Over at National Review, Nate Hochman is annoyed at Stanford University:
The demographic profile of Stanford University’s class of 2026 is out, with 1,736 matriculated students in the freshman class of one of the world’s most prestigious universities. But as some perceptive critics were quick to notice, one key demographic is disproportionately underrepresented: While whites make up more than 50 percent of the nation’s adolescent population, per 2019 Office of Population Affairs numbers, they were only 22 percent of Stanford’s class of 2026.
I was curious about this because there's something that I bet most people are unaware of: Stanford draws nearly half its students from California, which has a very different demographic profile than the rest of the country. Here it is for public school students:
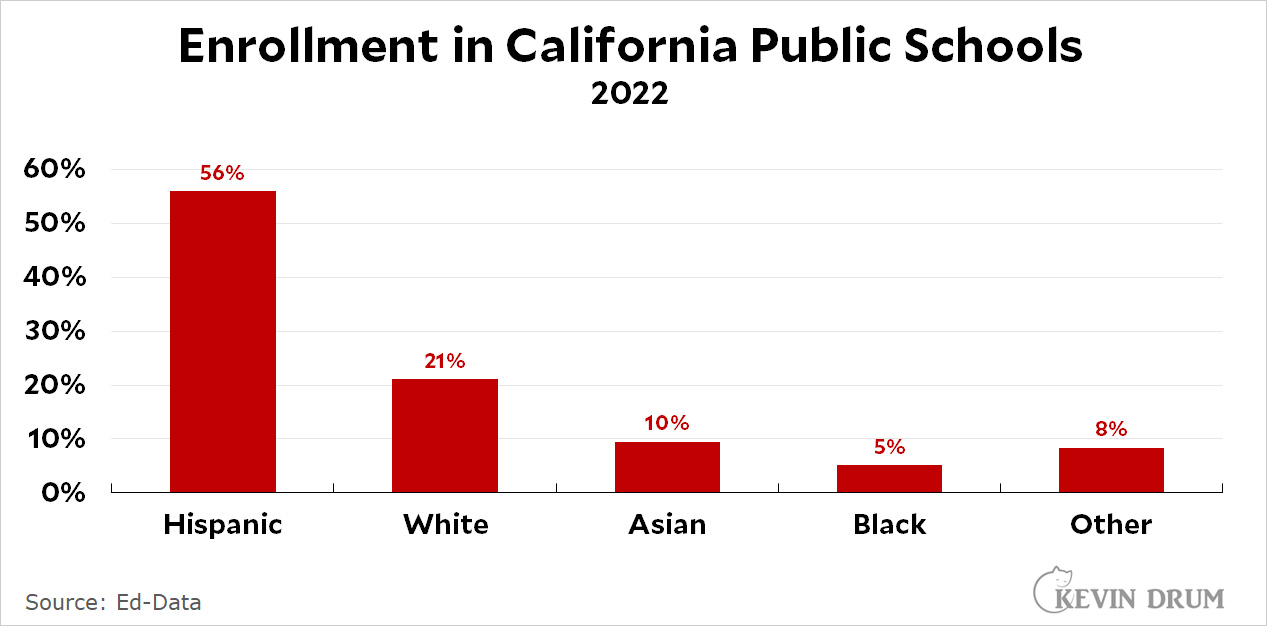 The white population is probably undercounted because these numbers are only for public schools, but not by much. Private schools make up less than a tenth of all California schools.
Stanford draws 40% of its students from California and 60% from other states. It's simple to calculate a weighted average of their applicant pool, which looks about like this:
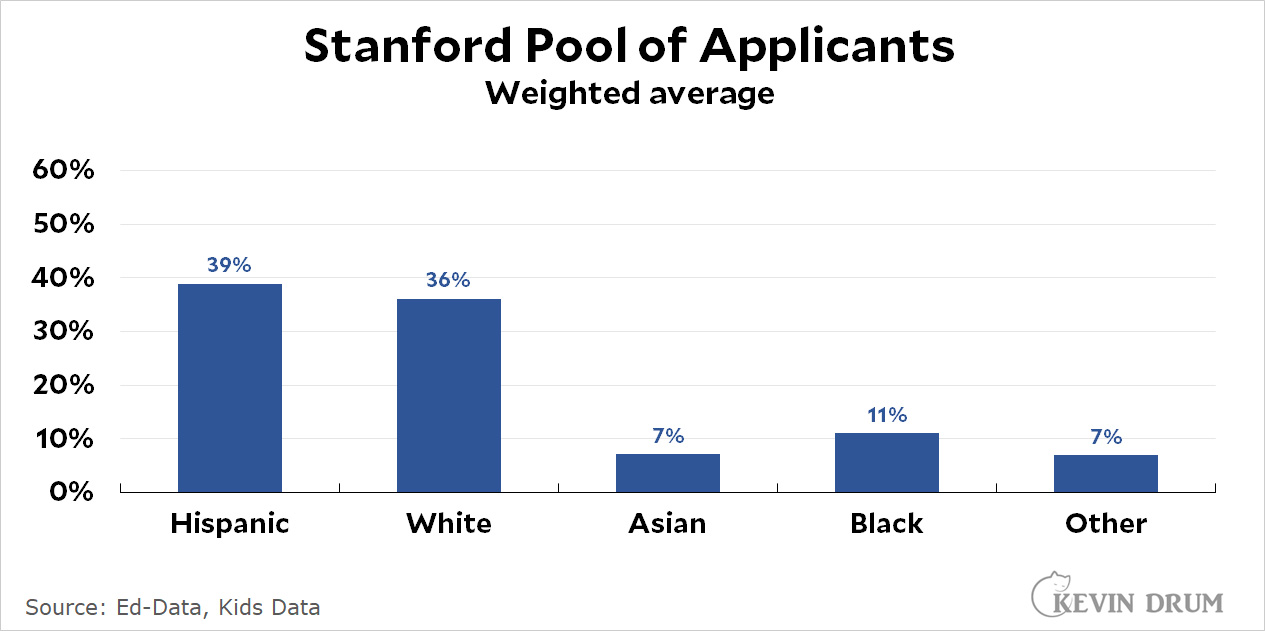 White kids are slightly more than a third of the total pool, not half.
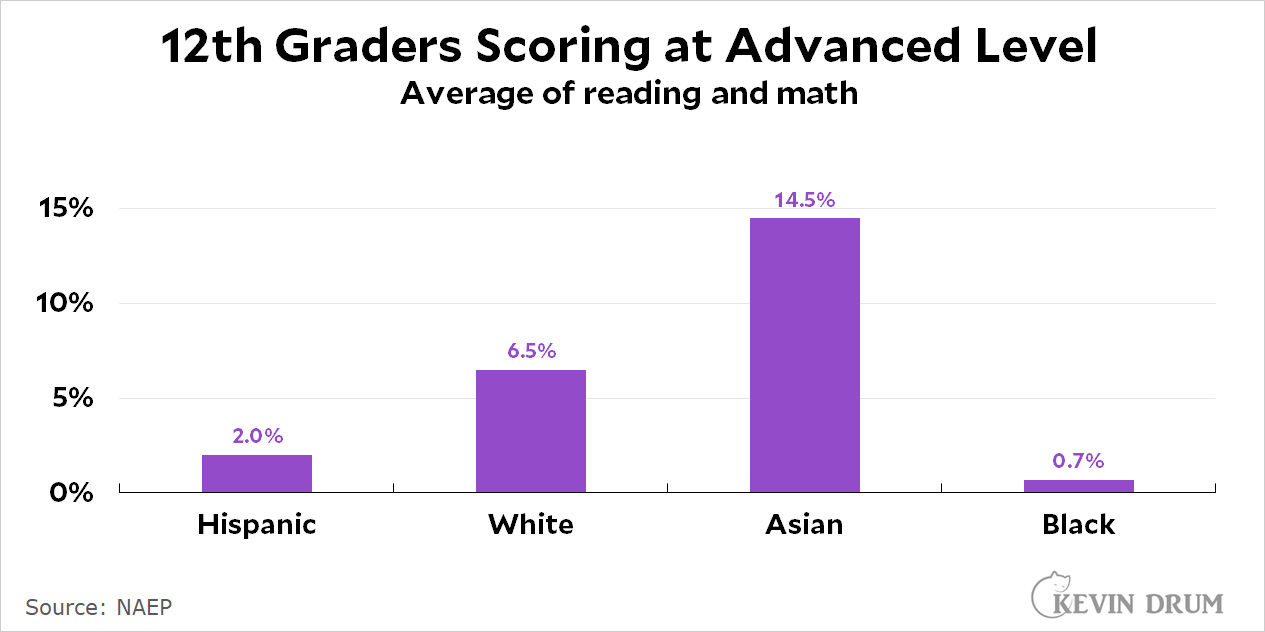
But this isn't enough: Stanford is an elite university that draws from about the top 5% of high school students. By chance, the "advanced" level on the NAEP test also represents approximately the top 5% of students, so this is the pool that Stanford draws from. Here's what it looks like:
 Now we need to apply this to Stanford's pool of applicants. For example, white kids make up 36% of Stanford's raw pool of applicants, but only 6.5% of those are performing at an advanced level. That's 2.3% of the total raw pool. Here's the number for all groups:
- Hispanic: 0.78%
- White: 2.35%
- Asian: 1.03%
- Black: 0.08%
This adds up to 4.23%, which means, for example, that Hispanic kids make up 18% of the entire pool (0.0078 ÷ 0.0423). Here's how this looks for all groups compared to Stanford's actual enrollment for the class of 2026:¹
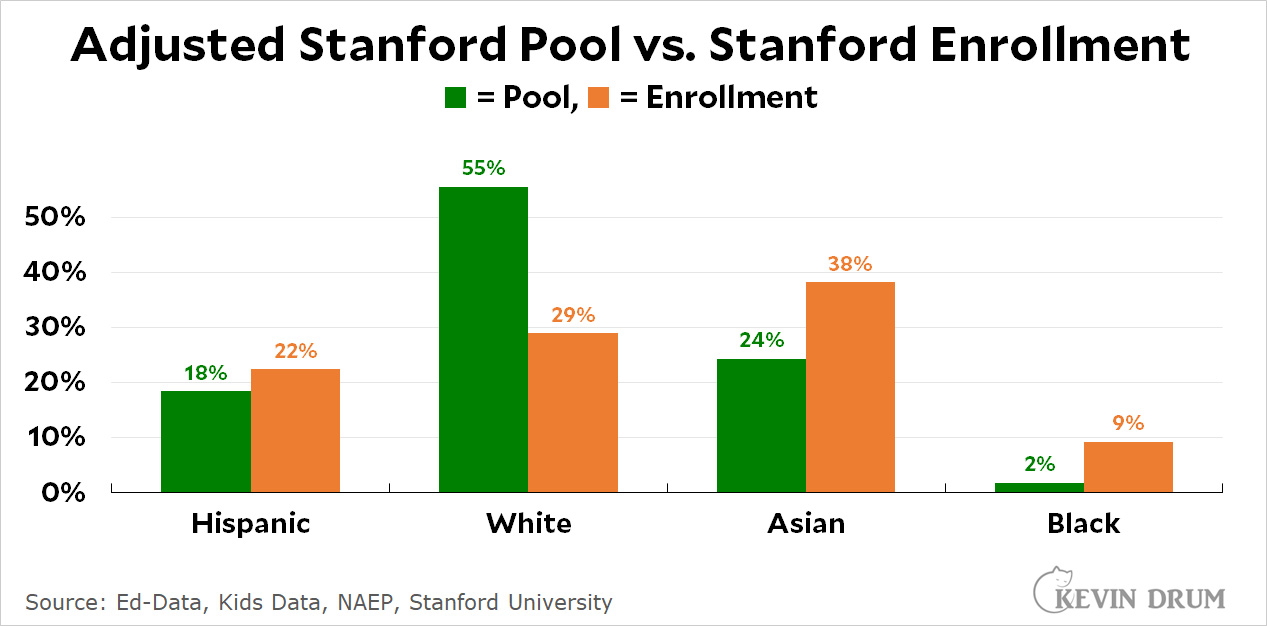 This is all fairly crude, but it's in the ballpark. And after all that work we're back where we started: white kids make up more than half of Stanford's total pool of applicants but only 22% of their enrollment. Hochman was right.
Oddly enough, this analysis makes it look like Stanford enrolls a disproportionate number of Asian students. If I had to guess, I'd say it's because all the other groups do poorly in math,² and Stanford might put more emphasis on math ability because of its high enrollment of STEM and computer science students. But that's just a guess.
¹Note that my percentages for Stanford enrollment don't match theirs. This is because I discarded two groups that didn't have racial IDs (international and multiple-race) and then recalculated the percentages.
²It's not because Asian kids do well in math and poorly in reading. In fact, they do as well in reading (14% advanced) as in math (15% advanced).
NOTE: California public school enrollment is here. National public school enrollment is here. NAEP scores can be extracted here. Stanford enrollment is here.
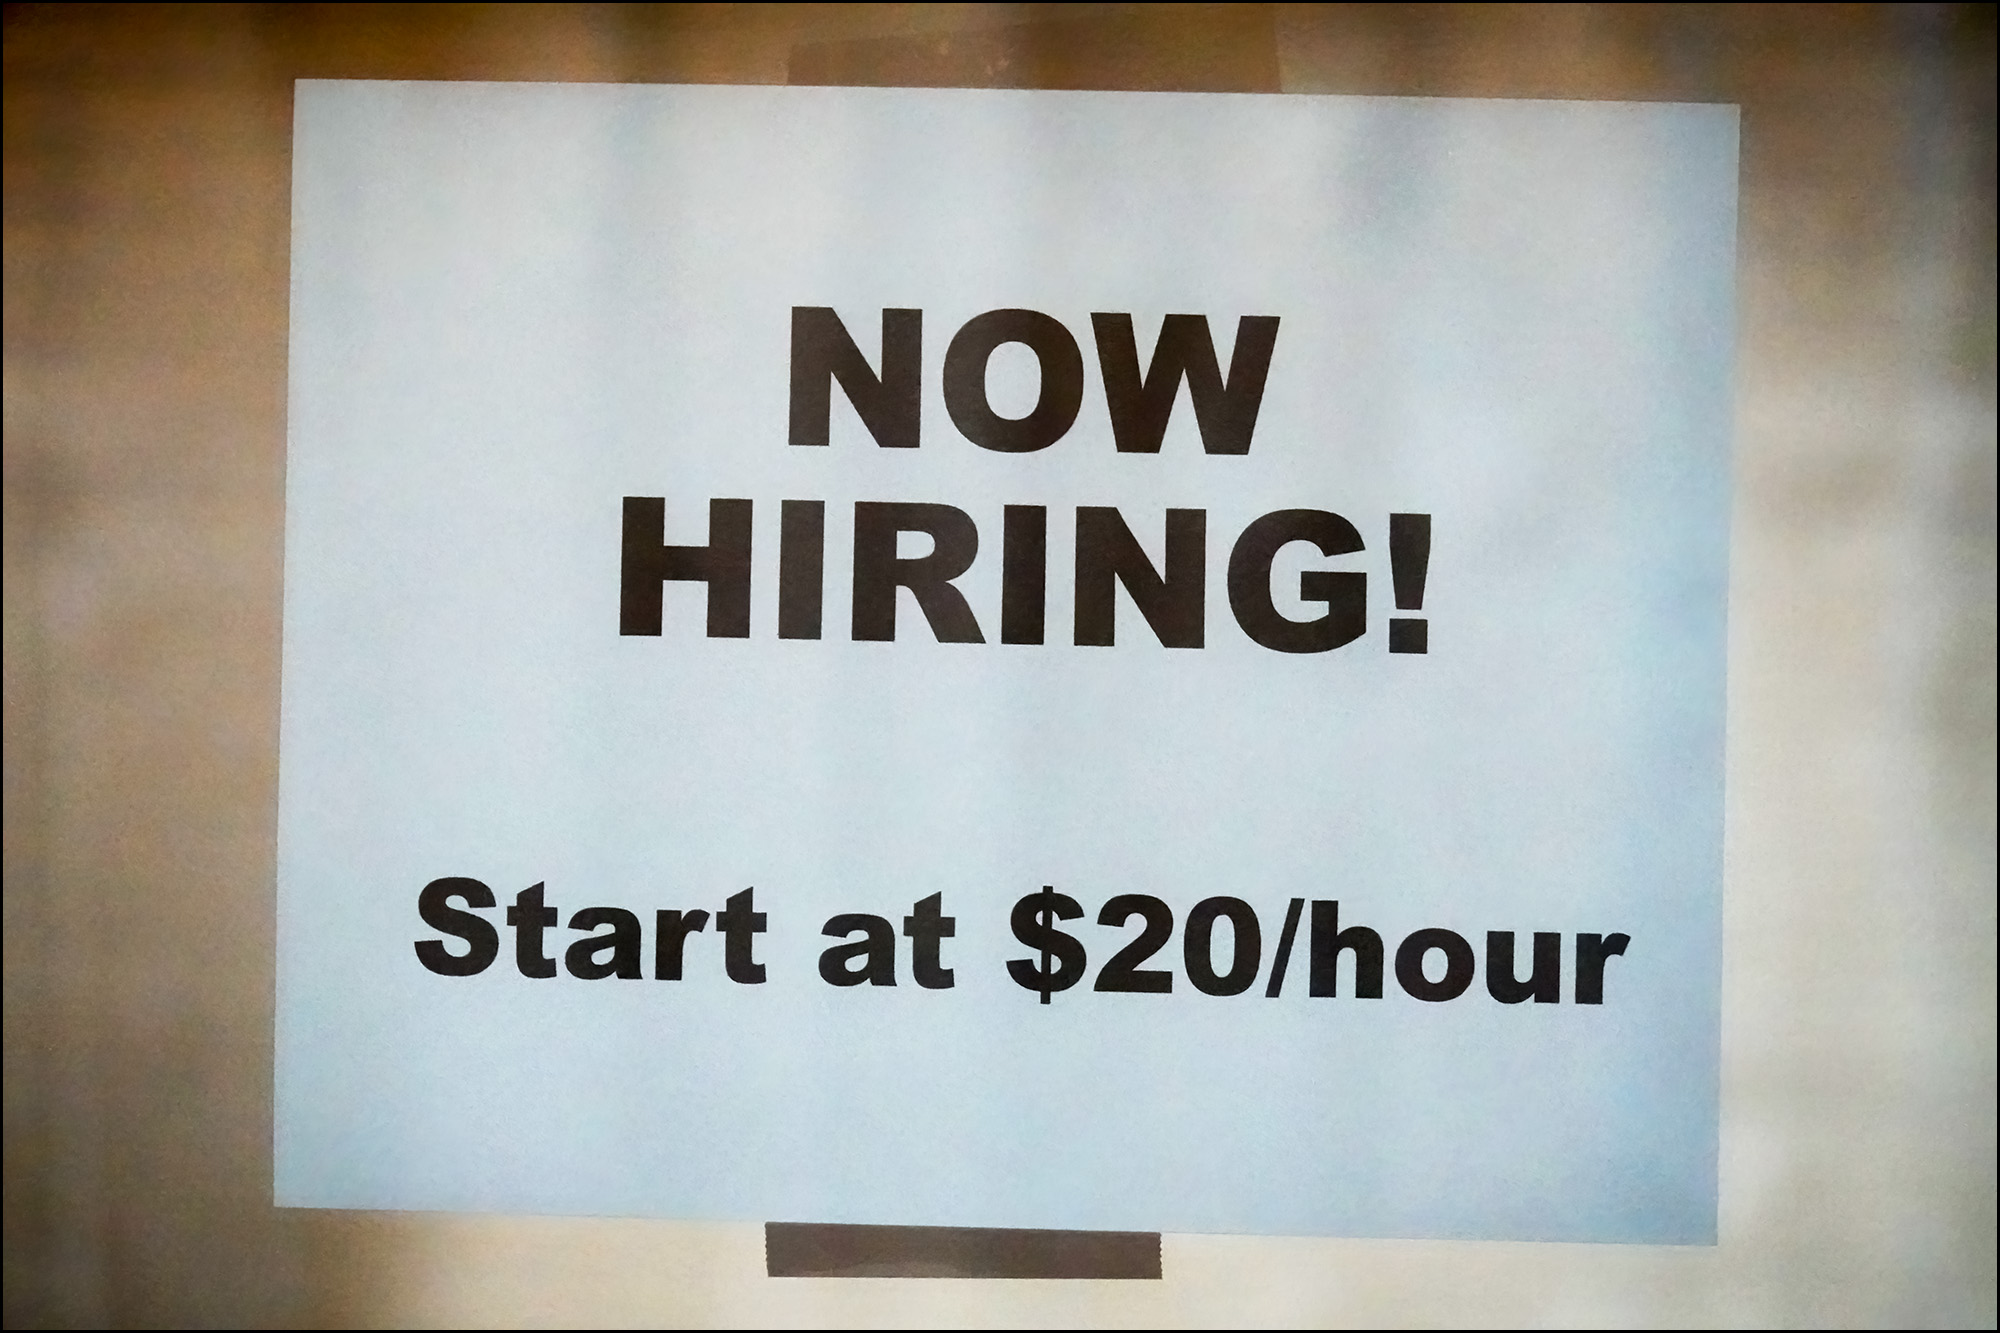 That seems pretty excessive, doesn't it? Fast food places must be desperate for workers to offer this kind of money.
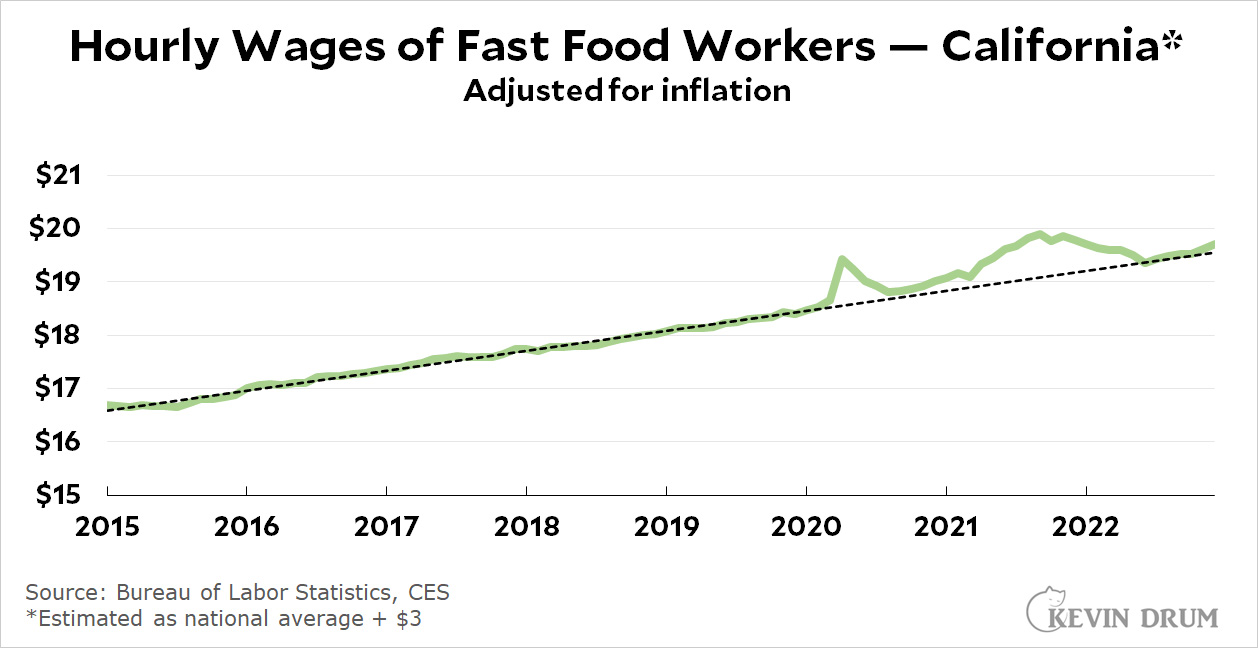 There's nothing new about this. Before the pandemic, the average hourly wage for a fast-food worker in California was $18.50. Today, after a few ups and downs, it's $19.50. A sign that advertises jobs for $20 per hour is just offering the average.