Skip to content

Our views of human extinction have changed over the millennia. Here are the ten best in more-or-less chronological order.

  1. Wrath of God. Wickedness of man causes God to destroy us. Reasons for hope: In Christian theology, anyway, God promised never to do it again after the whole Noah affair.
  2. Mayan calendar. December 2012 marked the end of a bʼakʼtun—a 5,126 year cycle in the ancient Mayan calendar—and with it the end of humanity. Reasons for hope: Experts say the whole thing is bosh even as mythology. Anyway, we're still around. 2012 came and went and all we got was a bad movie out of it. We should be safe until at least AD 7138.
  3. Revelation. A perennial favorite. Jesus returns, sinners suffer, and the faithful ascend to heaven. Reasons for hope: Nobody's ever been able to pin down a date for this.
  4. Alien invasion. HG Wells popularized it first, and since then this has taken every conceivable form, from a surprising thirst for our water to blasting Earth in order to clear space for a hyperspatial express route. Reasons for hope: Drake's equation and the Fermi Paradox.
  5. Nuclear apocalypse. This one shot up the charts in August 1945. Reasons for hope: None, really. On the other hand, even a real barn burner of a nuclear war isn't likely to kill every last human. It would be a big setback, but that's all.
    .
  6. Asteroid. If a big asteroid could kill off the dinosaurs, it could certainly kill us. Reasons for hope: This is a very rare event and it would be decidedly unlucky for it to happen during our lifetimes. Plus we're developing defenses that should be ready to go in no more than a few hundred years.
  7. Virus. An engineered virus spreads like wildfire thanks to modern technology and kills off the human race. Reasons for hope: It's harder than it sounds! Kill people too effectively and the virus burns itself out before infecting everyone. Slow things down and too many people escape. It's tricky.
  8. Climate change. This has become increasingly popular since climate change is, after all, a real thing. Reasons for hope: Homeostasis.
  9. Artificial intelligence. This is absolutely state-of-the-art in doomsday scenarios. Theories vary from the classic (computers just don't like us) to the lunatic (chess computers will go nuts and destroy the solar system in order to acquire the raw material for ever-better chess playing). Reasons for hope: We will probably merge with the computers soon and then it will be us on the rampage.
  10. Kevin's corollary. A favorite among the cognoscenti. AI continues to improve rapidly, remaining benign but ultimately becoming far superior to ordinary human intelligence. When that happens there's no longer any point in learning or doing anything since computers can do it all better. Humans become jaded and morose and eventually give up on all activity, including sex. Our computers are able to extend our lifespans considerably, but eventually the last of us dies quietly out of sheer boredom. Reasons for hope: None, unless you have a rosier view of human nature than I do. If so, please look around.

Happy New Year!

These are in no particular order.

  1. Kevin McCarthy still can't scrounge up the votes to become Speaker of the House. Ha ha.
  2. Vladimir Putin is getting his ass handed to him by a ragtag bunch of Slavs.
  3. The thuggish Jair Bolsonaro lost his reelection bid and fled Brazil for a life of exile in Orlando.
  4. Democrats retained control of the Senate.
  5. Boris Johnson was finally turfed out of office in disgrace.
  6. Nearly half a trillion dollars was approved to fight climate change.
  7. The "poster boy" of the January 6 insurrection was tossed in prison for five years. Two others were convicted of seditious conspiracy. In all, nearly a thousand people have been arrested and charged for their roles in the rioting. Half of those have either pled guilty or been convicted. More than 100 have received prison sentences.
  8. The Electoral Count Act passed on a bipartisan basis.
  9. The Le Pen family lost its eighth consecutive bid for the presidency of France.
  10. Katie Porter won reelection in California's 47th district against the odious zombie Scott Baugh.

This is an idiosyncratic collection. These charts don't "tell the story of 2022" and they're not the most important things I published all year. They just happened to intrigue me.

First up, naturally, is this chart of PCE inflation. I've posted it about a dozen times this year, so I might as well put it up one final time.

Was 2022 really a year of skyrocketing crime? We'll never know for sure since (a) FBI figures aren't available yet and (b) they'll never be available in comparable form to previous years thanks to a change in FBI methodology. But the evidence suggests nothing all that special happened. The big difference wasn't in crime itself, but in the coverage of crime by Fox News (left) right up until the moment the midterm election was over (right).

It seemed like every time we turned around there was another drug shortage. But there wasn't. In fact, drug shortages were below historical averages in 2022.

Thanks to a poorly executed chart that's made the rounds, everyone seems to believe that Millennials are the poorest generation in forever. But it only looks that way if you don't account for the sizes of different generational cohorts. If you look at wealth per person, Millennials are doing about the same as previous generations.

(As an aside, life looks kind of hopeless to a lot of young Millennials who are still paying off college debt and stuck in entry-level jobs. But guess what? Most of you are on the same track as your parents. When you enter your early thirties, your debt will be paid off and your incomes will be higher. Suddenly everything will look pretty normal.)

Republicans have always disliked Democrats and vice versa. That's normal. But the era of Newt Gingrich and Fox News has sent it spiraling out of control. The technical term for this is "affective polarization," which measures how much we all hate members of the opposite party. It has roughly doubled over the past 30 years.

How many unarmed suspects are shot and killed by police every year? Answer: In 2022 they shot 7 Black suspects and 26 white suspects. Both these numbers are down dramatically over the past seven years. Activism works.

This next chart was just one that surprised me: a third of all children in the US are investigated during their lifetime for possible maltreatment. A third!

Here's a favorite of mine. Lots of people like to say they take climate change seriously, but if you put an actual dollar figure on it their interest suddenly plummets. Even $10 per month is too much for all but a quarter of the population.

In the pre-Fox era, Democrats and Republicans both had about the same level of trust in the scientific community. Democratic trust has stayed high, but Republican trust began to wane in the mid-90s and then plummeted during the Trump era. It just became too difficult for conservatives to keep believing in a community that—for some mysterious reason—always seemed side with liberals.

Finally, here's my annual look at the growth of CO2 in the atmosphere. It still doesn't look like emissions are slowing down, does it?

Yes, I know I've chosen more than ten. Deal with it.

October 3, 2022 — The Andromeda Galaxy.
May 31, 2022 — "The Thinker" at the Rodin museum in Paris.
October 17, 2022 — Plane taking off at Palomar Airport.
June 6, 2022 — Four women at the Place de la Bataille de Stalingrad in Paris.
August 13, 2022 — A pelican diving for lunch at Dana Point, California.
May 28, 2022 — Young lovers on the Metro Line 9 in Paris.
October 2, 2021 — The Los Angeles skyline at dawn photographed via drone.
May 25, 2022 — A sculpture in the gardens of Versailles.
June 3, 2022 — The Garnier Opera House in Paris.
May 1, 2022 — A brightly lit succulent in Laguna Beach, California.
June 3, 2022 — Two dogs on the Île de la Cité in Paris.
May 19, 2022 — The Cluny-La Sorbonne metro station in Paris.
May 23, 2022 — Late afternoon landscape near Caen, France.

Earlier this week, the cranky and long-retired founder of Home Depot belched out his considered opinion about the state of today's youth—by which he apparently means anyone under the age of 70:

Nobody works, nobody gives a damn...."Just give it to me. Send me money. I don't want to work — I'm too lazy, I'm too fat, I'm too stupid."

There is, needless to say, no reason to take this even remotely seriously. Nonetheless, the Wall Street Journal sprang into action to declare a trend. "Where have all the go-getters gone?" it asks.

What follows is excruciating. They actually printed this, for example:

“The passion that we used to see in work is lower now, and you find it in fewer people—at least in the last two years,” says Sumithra Jagannath, president of ZED Digital, which makes digital ticket scanners. The company, based in Columbus, Ohio, recently moved about 20 remote engineering and marketing roles to Canada and India, where she said it’s easier to find talent who will go above and beyond.

Since the onset of the pandemic, several employees have asked for more pay when managers asked that they do more work, she says. “It was not like that before Covid at all,” she adds.

Employees asked for more pay when they were asked to do more work! How intolerable. So the company shipped their jobs overseas.

This is followed by a few more anecdotes, including one about an engineer who watched a TikTok that gave her the nerve to ask for a raise. So she did. And she got one! If the point of this story eludes you, join the crowd.

Another manager noticed that workers suddenly wanted to use more of their vacation time. How odd. What could possibly explain this after two years of being cooped up by a pandemic? Obviously they must be reassessing their entire work-life balance.

Then there are a few quickly googled surveys that are obviously junk. But you never see this:

Granted, this only goes through 2021 and both series are noisy. Still, it shows a steady rise in average hours worked over the past three decades for both managers (in all industries) and programmers. If you look at the same data for, say, retail or construction, you'll see no increase at all.

In other words, the kind of people the Journal is bitching about are precisely the people who have been working harder and harder over the years. They might want a little break or a vacation after the pandemic, and they might even want a raise after a year of 8% inflation. But this hardly means they're a bunch of lazy ingrates. The Journal should be ashamed for giving a platform to a few hastily telephoned people who apparently think so.

A few days ago, Tony Pipa of the Brookings Institution wrote about the dire state of America's rural communities:

A Policy Renaissance Is Needed for Rural America to Thrive

Shamokin [Pennsylvania] is a cautionary tale for what happens when we lack policy solutions that can truly help places cope and adapt to major economic and social shifts. Despite widespread acknowledgment since 2008 that rural places have generally been left behind, our nation still lacks a coherent federal rural policy.

....What we have are lots of programs — over 400 available for community and economic development spread across every nook and cranny of the federal government. But navigating that maze and the peculiarities of their applications, reporting and matching requirements is a high bar for anybody, let alone the part-time volunteer elected officials and the bare-bones staffs that make up many local rural governments.

....One thing is clear: Tweaking around the edges will remain ineffective. A serious policy discussion should be dominating the airwaves. Rural America is listening for how public leadership and resources can better support the economic and social renewal of rural communities, but it hears mostly silence.

This all sounds pretty conventional. Rural America is graying, losing population, and falling into poverty. We ought to get serious about doing something.

Maybe so. But first let me show you a pile o' charts. First off is income:

It's true that the average rural resident makes less the average urbanite. But they don't tax themselves very much and their cost of housing is far lower. When you account for that, they still make less but the difference shrinks from $26,000 to $18,000 to $9,000. But rural communities also have less education than cities. If you adjust urban income to match rural education demographics, the difference in income almost completely goes away. It turns out that rural residents aren't really any worse off than city folks if you compare apples to apples.

Here is unemployment:

Sometimes unemployment is higher in cities, sometimes in rural areas. But you may be surprised to see that unemployment is currently worse in cities than in the country. Here is poverty:

Contrary to popular belief, the rural poverty rate in 2021 was nearly the same as the urban poverty rate: 15.0% vs. 14.3%. And as the chart above shows, when you drill down below the county level it becomes obvious that persistent poverty is largely an urban problem.

Now let's take a look at something entirely different:

These are just examples, but it's obvious that a big problem with rural areas is that they choose to remain socially conservative, which chases out young people and hollows out their educated base. And their solution?

Despite the fact that most rural problems aren't all that bad—and are mostly of their own making anyway—they're convinced that the big thing holding them back is urban liberals who refuse to give them their fair share of federal money. This is despite the fact that it's common knowledge that urban areas transfer vast amounts of tax money to rural areas:

Here's my point: Rural America has problems. These problems aren't nearly as big as they're often made out to be, but they do have lower incomes, a declining population, and a less educated community.

But these are almost all caused by their own free choices. They refuse to tax themselves to pay for good schools and the infrastructure needed by business. They hold on tight to their social conservatism, which drives out both the young and the educated. Then they sit around and complain that the urban liberals who support them aren't supporting them enough.

Being rural is not like being Black or gay or female or Jewish. It's a choice. And the rural lifestyle is also a choice. They could do the things they need to do to become more prosperous, but they don't want to. They're comfortable the way they are.

And that's fine. Not only do I have no objections, but I'll even keep paying high taxes to support rural America in the manner to which it is accustomed.

But do I want to spend a lot of the government's time on a rural "policy renaissance" even though it's mostly alphabet soup money distribution that will always be resisted and scorned ("those city boys all think they know better than us") and will never solve the real problems of provincial culture? I'm not so sure I do.

Tyler Cowen weighs in today on a study of the lead-crime hypothesis:

These results seem a bit underwhelming, and furthermore there seems to be publication bias....I have long been agnostic about the lead-crime hypothesis, simply because I never had the time to look into it, rather than for any particular substantive reason. (I suppose I did have some worries that the time series and cross-national estimates seemed strongly at variance.) I can report that my belief in it is weakening…

Hmmm. I suppose that a quick look at the abstract of one paper might very well weaken your belief in something if it's the only thing you've ever looked at. Unfortunately, even mild pronouncements from Tyler tend to carry a lot of weight, so I suppose I should comment on this even though I'm sort of tired right now and don't really feel like it.

But let's do it anyway! I shall sprinkle exclamation points throughout this post in order to simulate energy and enthusiasm. But I'm afraid it's going to be kind of long and boring anyway. That's just the nature of these things. If you want to read along, the study is here.

First, though, just to get this out of the way: I don't know what Tyler means when he says "the time series and cross-national estimates" are at variance. I've looked at both and they seem to agree fine. Time series estimates tend to show that crime goes up and down based on lead levels in the past (i.e., during childhood), while cross national estimates tend to show that the peaks and troughs of crime line up with the rise and fall of leaded gasoline, which happened at different times in different countries. I'm not sure what the variance between these two types of studies is supposed to be.

But let's move on. I wrote about the study at hand a couple of years ago, and you can read my initial thoughts here. There are a few things to note:

  • It's a meta-study, which means it tries to average out the results of all the primary studies on lead over the past couple of decades.
  • It concludes that there's publication bias in the published studies. This is probably true, since I suspect there's publication bias in every field of study. To put it in its simplest terms, publication bias is the tendency for big, exciting results to get published while small, boring results never get written up in the first place—and if they do, they tend not to get published. This skews the public evidence in favor of positive findings.
  • It includes several other results, too, some of which I have a hard time reconciling. The main one, of course, is the conclusion that the effect of lead on the crime decline of the '90s is fairly smallish.

Let's start with publication bias. The authors provide two different "funnel plots" that estimate publication bias. One uses partial correlations while the other uses elasticities:

The elasticities measure the percent change in some measure of crime, given a percent change in some measure of lead pollution. They provide a better measure of the real effect rather than the measure of statistical strength the PCCs provide.

Fine. Here's the funnel plot using elasticities:

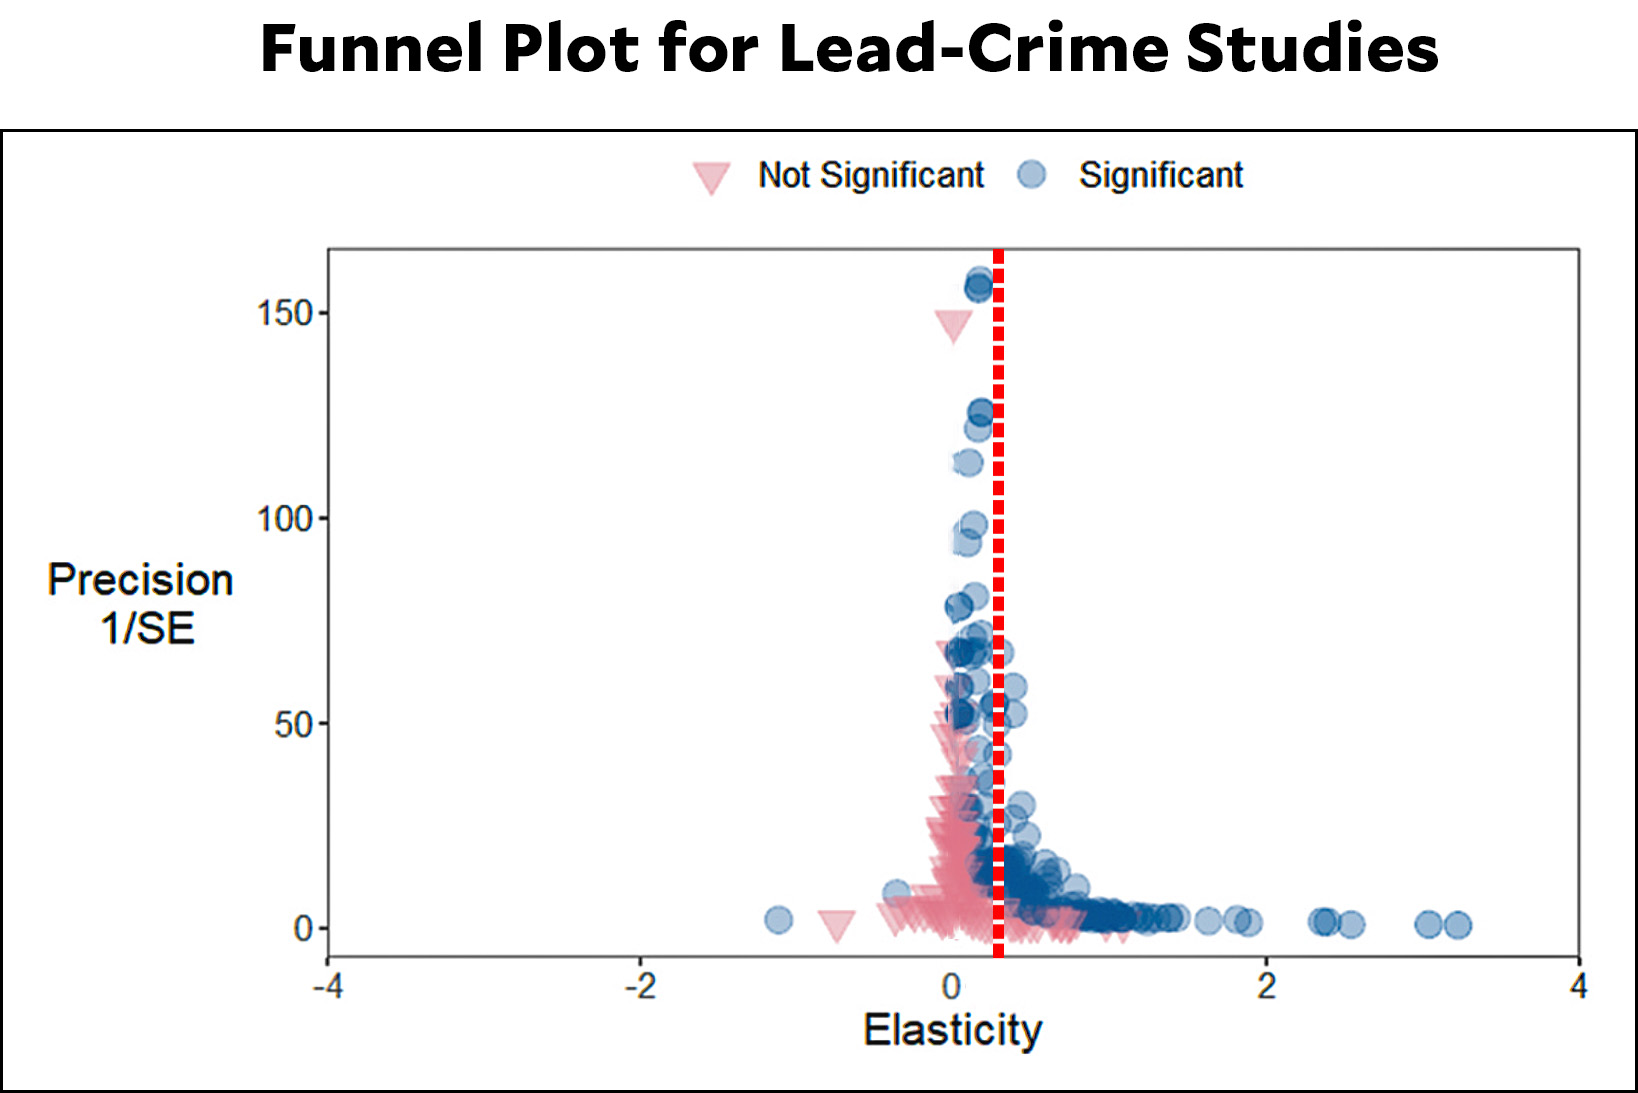
I've modified this plot to place a line roughly in the center of the data. If there were no publication bias at all the data would be symmetrical around this line. It's not. But it's also not that far off. This and other measurements suggest that publication bias is present. At the same time, this, along with other considerations, suggests the publication bias is not huge.¹

Next up is the measured effect size of lead on crime. The authors provide estimates for various subsamples, shown here:

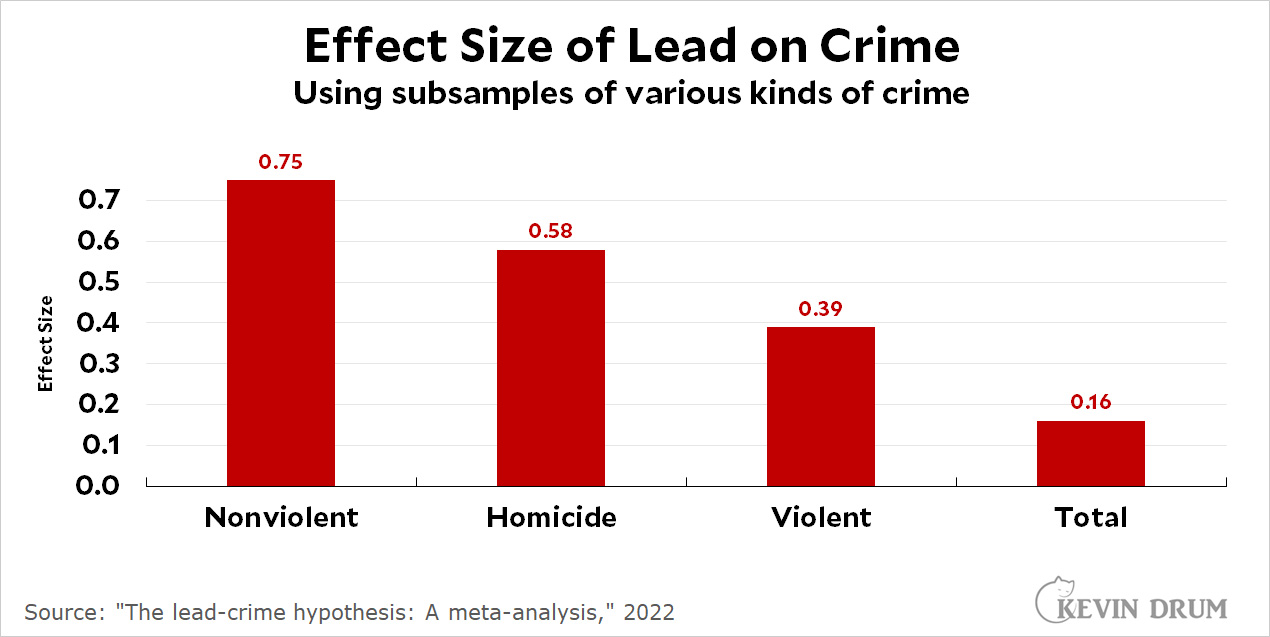
I have a feeling I'm misinterpreting this data somehow. Everyone in the field agrees that the effect of lead is greater on violent crime than on nonviolent crime, so why are they reversed here? This makes no sense.

I also have an objection to the authors' idea of what an "ideal" study would encompass:

The ideal specification we use is one that includes controls for race, education, income and gender, that uses individual data, directly measured lead levels, controls for endogeneity, uses panel data, is estimated without just using simple OLS or ML, uses total crime as the dependent variable....

The ideal study should focus on violent crime, not all crime. Nor should it focus very much on homicide, which many people think is the most accurate measure of violent crime.² It's not. The problem with homicide is that it has small sample sizes and produces a lot of variation, especially over small time periods. The best measure is violent crime over a long time period.

And that brings up a third point: Unless I've missed something, this paper looks only at the association of lead and crime beginning around 1990 when crime began to decline. But that's only half the data. Why do they ignore the rise of crime in '60s and '70s? That's a big piece of the evidence in favor of the lead-crime hypothesis.

And there's more! As the authors point out, most lead-crime studies are ecological. That is, they compare one area with another (different states, for example) and look to see if one thing—average lead exposure—is correlated with another thing—average crime. These studies are useful but tricky, with lots of pitfalls that can produce spurious results because they compare only averages to other averages.

The gold standard for lead-crime research is a study that compares individuals over time. One type of individual study might measure, say, bone lead levels in a random group of adults and use it to estimate childhood levels, which it then compares to present-day crime records for each person. Another type is a prospective study, where you choose a random group of kids, measure their lead exposure levels, and then look at them 20 years later to see if individual lead levels correspond to individual crime rates. The problem here is obvious: you can only do this if someone collected the childhood data 20 or 30 years ago. This didn't happen very often, and I'm aware of only a few examples:

  • Cecil, University of Cincinnati Lead Study
  • Sampson, Project on Human Development in Chicago Neighborhoods
  • Beckley, Dunedin Multidisciplinary Health and Development Study (New Zealand)
  • Liu, 4 preschools in Jintan, Jiangsu province of China
  • Needleman, Juvenile Court of Allegheny County

Two of these aren't even included in the meta-study, probably because they didn't fit the authors' fairly stringent requirements. However, all of them show roughly expected levels of increased crime rates in adults who were lead-poisoned as children.

TO SUMMARIZE: I'm not a statistical guru and I don't promise that I have everything right here. Nor should this post be construed as any kind of criticism of the authors. Meta-studies are good things; publication bias is real; and their methodology seems reasonable.

That said, a few things seem a little out of whack. It would be nice if the lead-crime community could take a look and formulate a response of some kind.

¹As I've written before, it's useful to consider how likely publication bias is in any particular area. Are you looking at studies of antidepressants? Pharma companies would love to bury null results, so watch out for publication bias! Are you looking at quick-and-dirty studies that use classrooms of undergrads as their subjects? Those often aren't even worth writing up if the results are uninteresting, so watch out for publication bias!

Lead-crime studies, by contrast, are moderately complicated and take a while to finish. That's a chunk of your career, and you probably don't want to throw one out just because it wasn't super exciting. There are also no big motivations to ignore studies that are inconvenient. Bottom line: this is not a field that seems likely to produce a huge amount of publication bias.

²Homicide has the advantage of being easy to estimate: someone is either dead or they aren't. Other types of violent crime require a certain amount of human judgment to categorize them properly.