This is Hilbert's favorite new place—if Marian isn't around, anyway. In the background you can see the communication hub of my blogging empire, complete with telephone and everything.

Cats, charts, and politics

This is Hilbert's favorite new place—if Marian isn't around, anyway. In the background you can see the communication hub of my blogging empire, complete with telephone and everything.
Today brings an updated paper on the impact of Fox News on American elections. Here's the basic chart for presidential elections:
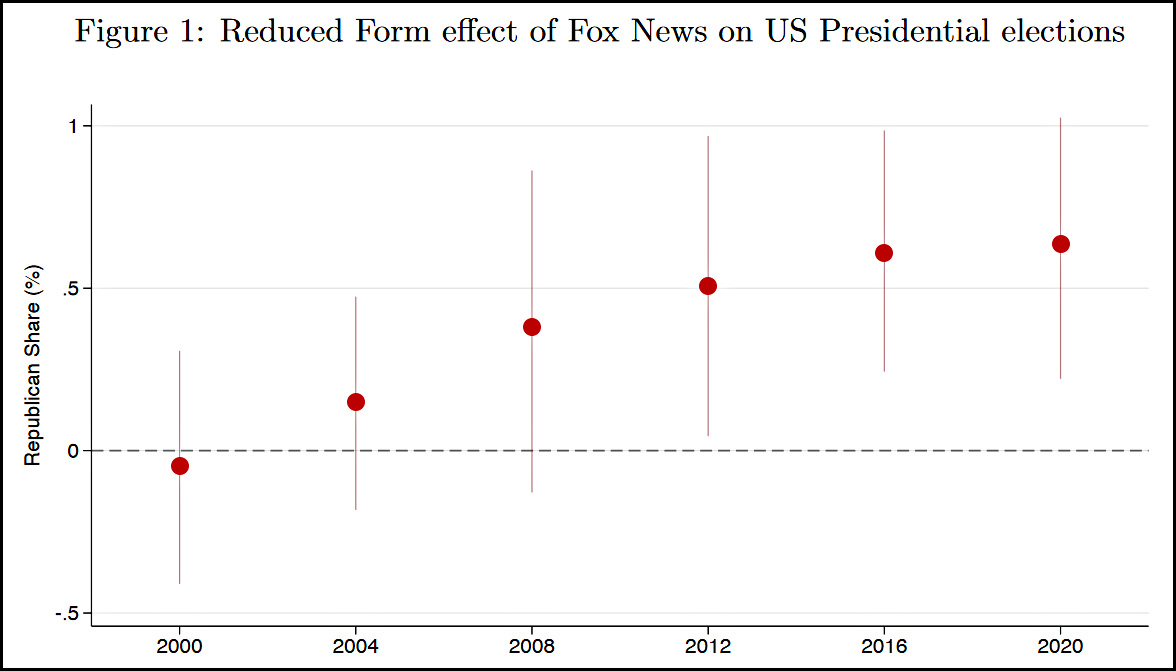
The methodology is the same one the authors have used before, which relies on the channel position of FNC in local markets. It turns out that the lower the channel position the more a channel is watched, but the channel position is basically random. This provides a way to answer the question: "If someone is randomly exposed to more Fox News, what happens?"
The answers are (a) they become more conservative, (b) they become more Republican and (c) they vote more for Republicans. The results are substantial:
A one-standard-deviation decrease in FNC’s channel position increases the share of Republican voters by about .75 percentage points....The effect sizes are substantively quite large. Indeed, the effect of just a one standard deviation shift in FNC’s channel position (roughly 29 positions), which induces about 7 minutes of additional viewership per week, is larger than the effect of a one standard deviation change in local real wages.
If I'm reading this right, it means that seven minutes of Fox News per week is likely to increase the Republican share of the vote by 0.75 percentage points. The authors find similar effects for House, Senate, and Governor's races.
As you can see from the chart, the effect of Fox News increased steadily early on, as Fox became more conservative at the same time that it broadened its reach on cable systems. It appears to have stabilized more recently, which is unsurprising since Fox is on pretty much every cable system now and can hardly crank up the conservo-meter any further.
This is the kind of research I'd like to see for social media. It wouldn't be easy since you need to find some kind of endogenous instrument (like channel position) to base your comparison on, and it's not clear what that might be. And the results are likely to be fuzzy since social media, unlike Fox, is not 100% ideological in a specific direction. Still, someone clever needs to take a crack at it. Based on the evidence we have right now, I suspect that the impact of social media on elections is fairly small, but it would be nice to see something more rigorous on the subject.
I've been seeing an awful lot of this lately:
There’s been a lot written about the parallels between Biden and FDR. But there’s one less-covered parallel that sticks out to me: Like FDR, Biden is trying to enact a big agenda to revitalize faith in American democracy. https://t.co/0rvSCeGvab
— German Lopez (@germanrlopez) April 30, 2021
I suppose it's reasonable to say that Biden would like to be the next FDR—what Democrat wouldn't?—but there's a big difference between the two: FDR passed lots of permanent social programs that changed the country forever while Biden hasn't. Other than that, they're nearly the same!
Honestly, I really don't get the Biden-FDR comparisons. So far Biden has proposed a bunch of stuff, and if he passes it all he will certainly go down as a pretty influential president. But so far he hasn't passed any of it and there are some serious doubts about whether he can. For starters, he's limited to whatever he can pass via reconciliation, and beyond that he can only pass programs that are supported by every single Democrat in the Senate. This is . . . difficult.
I'll be rooting for him, but the FDR comparisons really ought to wait until he's accomplished a few big things. Permanent things. That's going to be some tough sledding.
We have yet more exciting economic news this morning! The eurozone released its Q1 figures for GDP and they were not good. Real GDP fell by 0.6% from the previous year while US GDP was increasing:
Assuming I did this chart correctly—never a sure thing when dealing with Eurostat figures—US GDP has outpaced EU GDP by more than 5% over the past few years, with most of the difference coming in the past couple of quarters.
Perhaps this will change as Europe recovers from COVID-19. In the meantime, US COVID rates are lower than Europe; US vaccination rates are higher than Europe; and the US economy is growing quite a bit faster than Europe's. Now do you see why I'm basically bullish on America compared to the rest of the world?
If you're looking for some good news, check this out:
Personal income skyrocketed by more than $4 trillion in March nearly all of it due to the $1,400 checks in the Democratic rescue plan passed earlier this year. Consumer spending increased $616 billion while all the rest was put into personal savings.
I'll confess to some confusion. The total rescue bill amounted to only $1.9 trillion, and the $1,400 checks supposedly cost about $400 billion. So where did the $4 trillion come from? I am puzzled, but if I find out more I'll let y'all know.
UPDATE: Ah. Dean Baker points out that this is an annualized rate. It's right there in the footnotes on page 4 of the BEA release! Sheesh. Would it kill them to say, "Personal income increased at an annualized rate of $4.21 trillion" in the main text?
Here’s the officially reported coronavirus death toll through April 29. The raw data from Johns Hopkins is here.
Sunrise over the Mojave Desert.

Using the normal way of accounting, real GDP was up 6.4% in the first quarter of the year:
Here's another way of looking at it:
We're still about half a trillion dollars shy of where we'd be if there had been no pandemic and GDP had followed its previous growth path. With any luck, however, we should be able to make that up by the end of the year.
Here’s the officially reported coronavirus death toll through April 28. The raw data from Johns Hopkins is here.

NOTE: Please read the update and this post. It seems likely that, in fact, the J&J pause had little to no effect on vaccination rates or vaccine hesistancy.
A couple of weeks ago we were arguing about the public effect of the CDC's pause on the Johnson & Johnson vaccine. Would it make people more confident in vaccines because it shows that the CDC is really on the job? Or would it make people less confident in vaccines because it shows that they aren't as safe as we thought? Daniel Bier presents this as evidence today:
And yes, the decision to yank J&J’s vaccine was the trigger.
Daily vaccinations were rapidly growing for every demographic under 50, and stable for 50-64, until the FDA’s “pause” (as though they could unclick that button and undo the damage).
They abruptly u-turn: pic.twitter.com/6GJ6m46PKm
— Daniel Bier (@FT__Dan) April 28, 2021
What this shows is that people ages 18-49, who were rapidly increasing their vaccination rate, took a sudden lurch downward right at the time the J&J pause was announced. Those from 50-64, who were holding steady, also took a big downward dip. Conversely, those under 18, who were approved only for the Pfizer vaccine, showed no change in response.
Is this proof that the J&J pause produced the drop in people getting shots? Of course not, but it's certainly suggestive. Did anything else happen in mid-April that might account for this?
UPDATE: Here's another chart showing vaccination doses by brand:

The sharp decline in J&J doses is obviously part of the reason for the overall drop in vaccinations. However, both the Pfizer and Moderna vaccines also suffer a drop. The Pfizer vaccine, in particular, begins to decline at about the same time the J&J pause is announced.
This complicates the picture, though I'd say the evidence still points toward the J&J pause being responsible for an overall drop in in people getting vaccinated.