Skip to content

We all know that abortion rights tend to be popular at a nationwide level—even more so following the Dobbs decision. Most polling suggests that around 60% of Americans think abortion should be legal all or most of the time.

But nationwide doesn't matter since Dobbs made abortion a state matter. Abortion is now banned, or mostly banned, in a dozen states throughout the South plus a handful elsewhere.

But are abortion bans popular even in these states? This is where things get curious. We don't have a lot of state polling, but we do have one comprehensive poll: a survey of all 50 states done in February by PRRI. Here's what it looks like:

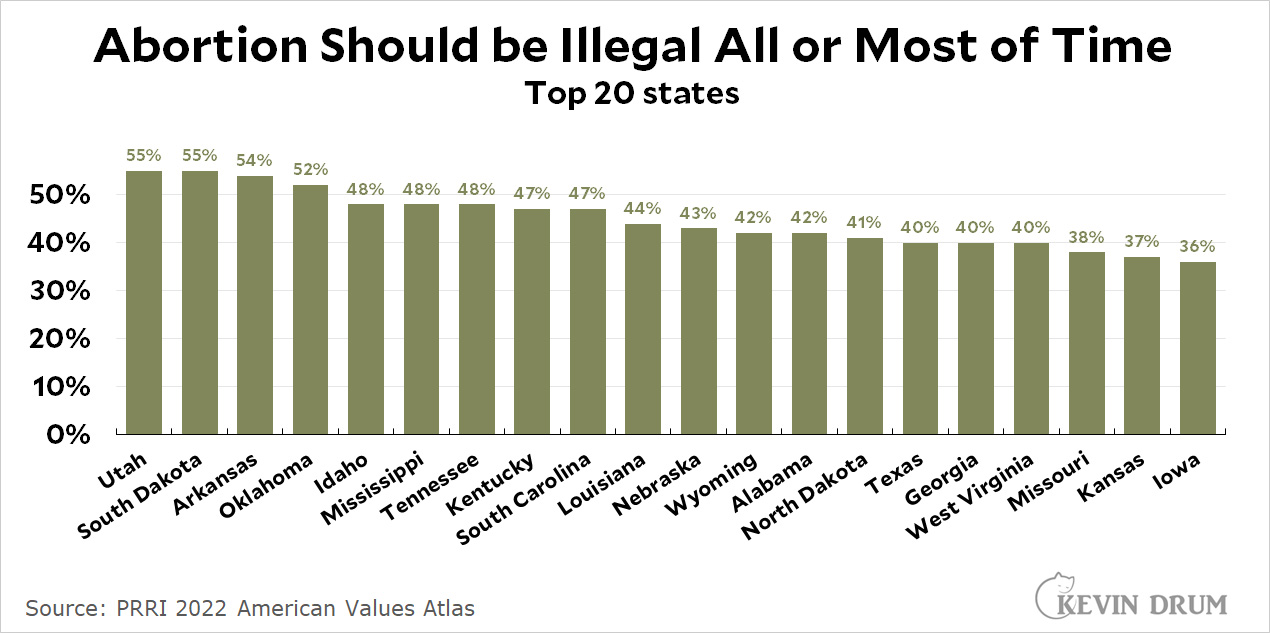
I can't say for sure how reliable these numbers are, but they sure seem to suggest that abortion bans are not especially popular even in deep red states. In only four states is there even a bare majority that thinks abortion should be banned all or most of the time.

Other states are even weaker. In Texas, one of the most aggressive states to ban abortion, only 40% of residents think abortion should be illegal all or most of the time. In Florida it's only 33%. No wonder Ron DeSantis dithers so much about acknowledging the abortion restrictions he signed into law.

In all of these states there are conservative Republican majorities against abortion, and obviously that's the only thing extremist Republican legislators care about. Nevertheless, this polling explains why pro-abortion referendums often succeed even in red states: when everyone votes, they have pretty clear majority support. It's only when the zealots can ignore half their constituents that abortion bans have a chance. Unfortunately, history suggests they can keep ignoring them for a good long while.

The Wall Street Journal has an inexplicably fascinating story about gambling in Las Vegas today. I've long been accustomed to hearing about microscopic changes in gambling rules to favor either the house or (via negotiation) high rollers, but now casinos have thrown all their subtlety out the window. For example, if you hit 21 on your first two cards in blackjack, it used to pay $15 on a $10 bet. Now it pays only $12. Roulette wheels used to have two green slots, zero and double-zero, that paid out nothing. Now they have a third slot, triple-zero, that also pays out nothing.

In the delicately balanced world of big-time gambling these are huge changes—and they're obviously right out in the open. How can casinos get away with fleecing regular customers like this?

The answer appears to be simple: they don't care. Gambling in Vegas is up a whopping 25% since the pandemic ended and casinos are stuffed to the gills. They can reduce payouts as much as they want and they'll still have thousands of punters jockeying for a place at the tables.

Life is good when you have so much business you can barely handle it. And when it comes to blowing off steam after the pandemic, apparently Vegas was firstest with the mostest.

Today really is the start of the French Open, so here's a pair of pictures of Court Simonne Mathieu, the newest of the courts at Roland Garros. As you can see in the top picture, it's a sunken court. The entrance leads to the top level, not the bottom. The bottom picture shows the court itself, all of it below surface level.

May 27, 2022 — Paris, France

An op-ed in the New York Times today caught my eye: "The Real Reason Your Groceries Are Getting So Expensive." This got me curious: are groceries getting more expensive? I haven't checked for a while. Here's the answer:

Food inflation peaked in early 2022 but it's been plummeting since then. Groceries are still more expensive than they were a year ago, but on a month-over-month basis we're actually starting to see some deflation in food prices. For the past couple of months, groceries have been getting cheaper, not more expensive.

Now, the op-ed that caught my eye is more about long-term antitrust policy and the effect it's had on smallish food chains, not the latest inflation numbers. So there's a bit of apples and oranges here. Still, for the moment anyway, grocery prices are pretty clearly on a significant downturn.

Just as a minor historical note about the debt ceiling, it has been killed off before—for nearly 15 years. Dick Gephardt did it in 1979:

He consulted the parliamentarian. "I asked if there was a way that when we pass the budget [the debt ceiling] can be deemed 'raised' to accommodate the budget people are voting for," Gephardt said. "He said, 'Yeah, we think we can work that out.'"

Thus was born the "Gephardt rule." For a period thereafter, the adoption of the conference report on the budget resolution would trigger the Gephardt rule and "deem to have passed" legislation raising the debt limit to accommodate the spending and revenue levels approved in the budget. Presto! Problem solved.

Unfortunately, anything that can be legislated can also be unlegislated. When Democrats lost their majority in the Gingrich landslide of 1994 the Gephardt rule was quickly abolished. Republican revolutionaries wanted the debt ceiling back as leverage to force spending cuts—including two government shutdowns—on President Clinton. It's been with us ever since.

A new study of online news in 2020 has produced some dramatic—if unsurprising—results about consumption of misinformation between conservatives and liberals. It's a little complicated so I've split it into multiple simpler charts. Here's the first one:

The top set of points shows raw exposure: it's what Google shows you when you perform a search. As you can see, it's about the same for everyone.

The middle set of points shows what users actively choose to follow. This is not the same for everyone: Republicans choose to follow much more partisan news than anyone else.

The bottom set of points shows overall engagement and is even more dramatic. Republicans are far more likely to actively engage with partisan news than either Democrats or Independents.

The next chart shows how this shakes out in a measure of unreliable news:

Among Republicans, high engagement goes hand-in-hand with unreliability. The result is this:

As before, the top set of lines is merely what Google initially presents. There's little difference between partisans. But the bottom set of lines shows what people actively engage with, and the differences could hardly be more stark. Republicans freely choose to engage with far more unreliable news than anyone else. They crave it and they seek it out, even when the original search produces perfectly reasonable results.

I showed the results here only for the 2020 wave of data, but the authors performed the same analysis in 2018 with much the same results:

The two waves of our study replicate the same finding: engagement outweighs exposure to partisan and unreliable news within Google Search....Our results highlight the role of user choice, rather than algorithmic curation, in driving such effects

Conservatives don't get passively fed misinformation. They choose it, eyes wide open. They want to believe lies and conspiracy theories from people like Donald Trump, and after they "do their research" the comforting lies are all that's left.

But what is it that makes the endless lies so comforting?

Texas Attorney General Ken Paxton is almost comically corrupt. He's been under federal indictment for securities fraud since 2015. In 2020 whistleblowers accused him of abusing his office to help a wealthy donor. Last year he requested state funds to pay off the whistleblowers, who had accused him of retaliating against them:

Among the allegations were that Mr. Paxton gave special treatment and abused his office to help Nate Paul, a friend and campaign donor in Austin, in several instances. Lawmakers also said that Mr. Paul helped with renovations on Mr. Paxton’s home and employed a woman with whom Mr. Paxton had been having an affair, actions that amount to bribes in the eyes of Mr. Paxton’s critics.

The impeachment articles also include claims that Mr. Paxton directed his employees to violate the state’s open records law, fired employees who reported his bad behavior, made false statements to a state board, did not accurately disclose his finances and stalled a separate criminal prosecution that accused him of securities fraud.

Here's what I don't get. This stuff has been going on for years. Everyone knew about it because it's been all over the front pages. Paxton's corruption is all but an open record, but he's maintained his political support anyway.

So why now? Out of the blue he's hit with impeachment and the vote against him is overwhelming, 121-23. A special Senate session to vote on conviction will be called within days or weeks.

What happened? Why did the dam break so suddenly? Is there more going on behind the scenes than we know about?

Apparently a debt ceiling deal has been reached. There's surprisingly little to it, chiefly a freezing of domestic spending in next year's budget. At a guess, this means cuts of maybe 3-4% after you adjust for inflation. In the following year, spending would increase 1%, which probably represents further cuts of 1-2% after inflation. So this comes to total cutbacks over two years of around 5% or so. There are no reported changes to Social Security, Medicare, or Medicaid.

That's a substantial slash to domestic programs. In addition, the deal includes some work requirements for food stamps and some mild permitting reforms to allow federal energy projects to pass environmental review more quickly.

And that's about it. Now it's just a matter of seeing if it can pass.

A couple of days ago Farhad Manjoo wrote that office workers aren't sick of work, they're sick of the commute to work:

For many, the pandemic-era shift to remote work proved that all the schlepping was unnecessary....They can get a lot more done — in their work lives and in the rest of their lives — if they skip the commute.

Liberty Street Economics, a blog that features writing from New York Fed analysts, reported last year that collectively, Americans now spend 60 million fewer hours per day traveling to work. That’s 60 million hours for which they weren’t being compensated that they can now spend exercising, taking care of their children, getting a bit more sleep and starting their workday earlier or ending it later.

There's obviously something to this. No one likes commuting, and barren downtown office spaces offer evidence that there's less of it these days. But that 60 million hour figure is for the pandemic year of 2020 and things have changed since then. Here are a couple of suggestive charts.

First up is the crudest possible measure, Vehicle Miles Traveled per working-age person (for the first quarter of each year):

VMT dropped substantially during the pandemic era, but it's since rebounded and is close to its pre-pandemic level. People are back to driving as much as they ever were.

Next up is a closer look specifically at commute times via the American Time Use Survey. This time we can go through the end of 2021 and the numbers tell a different story:

We don't know what happened in 2020 because ATUS was interrupted during the pandemic, but it's safe to say that commutes were down—probably quite a bit. A total of 60 million hours doesn't seem unreasonable. This rebounded in 2021, but only partly: 35% of people commuted before the pandemic but only 28% in 2021—though I imagine that number has increased since then. However, average commute time among those who still commuted was barely changed, down less than two minutes.

This all suggests that, in fact, commuting is returning to its old levels, though slowly. Workers might or might not like it, but they're mostly doing it.

And one other thing. There's a reason bosses want their workers coming into the office. Here's a chart from Liberty Street Economics based on a careful analysis of what people did with the time they saved from their commute in 2020. It's pretty startling:

Look at the red lines at the very top representing all age groups. Non-commuters worked a lot less at the office and made up for it with only a little more work at home. Altogether, in 2020, they reduced their total working time by a whopping 3.5 hours per day, replaced mostly with leisure and sleep. Their productivity might have remained strong, but they simply weren't putting in the hours. Is it any wonder that with the pandemic over, CEOs and managers want to see butts in chairs where they can be sure everyone is really working?

UPDATE: The second table above originally showed commute minutes per day. I changed it to the percent of people commuting because that gives a better idea of just how much commuting has (or hasn't) fallen off following the pandemic.