Credit card debt rose in November at an (annualized) rate of 17.7%. Holy cow! But here's what that looks like:
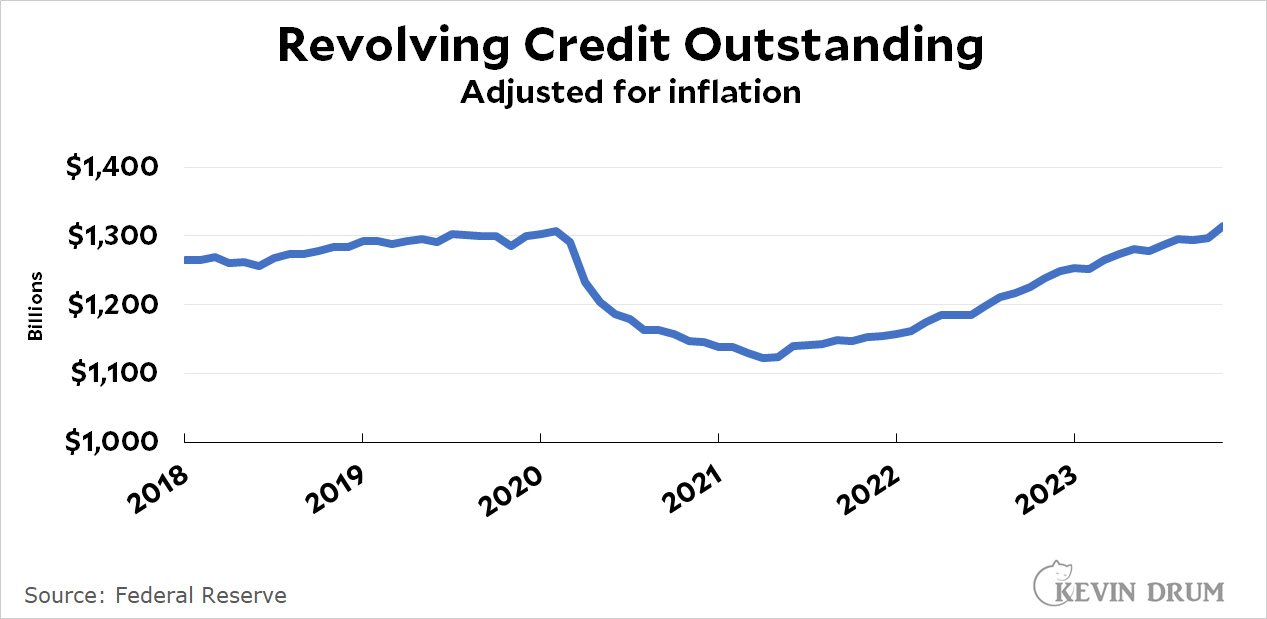 Credit card debt has been rising steadily ever since it recovered from the pandemic crash. It's now back to about where it was in 2019.
True, 17.7% is a lot. But the data is pretty volatile. Revolving credit was up 14% in May. It was also up 14% last November and last July. It was up 19% in June of 2021. So the latest number might be a sign of a dangerous rise in consumer debt or it might not. There's no way to know yet.
But those interest rate hikes sure haven't had any effect yet, amirite?
And workers are doing just fine, with wages keeping up with official measures of inflation, amirite?
Yeah sure you betcha.
Make $280 per hour. Getting a job is not easy. In any case, you have access to a wealth of resources to help you with your work style. Become motivated to promote hundreds of jobs through job boards and vx05 career websites.
Take a look at this................................. https://careershome74.blogspot.com/
The chart appears to be fairly supportive of the argument that interest rate hikes havent had much of an effect on the economy.
CC debt without adjusting for population or GDP growth remains at 2019 levels.
"remains at 2019 levels"
That's a really misleading way to put it. It ignores the drop (due to COVID cash, because surprise! people in worse financial situations spend extra cash improving their situation) as well as the steady increase since then - a rate of increase that's higher than the pre-COVID trendlind which means it is NOT about population growth or GDP growth (which would be a stupid thing to adjust CC debt levels for).
My point was mainly about how **revolving** balances are increasing. The interest rate hikes have a direct and IMMEDIATE impact on those.
Sheesh.
What is the revolving debt as a percent of GDP?
Yes, normalizing by GDP or total or median wages would be more informative.
You can still eyeball it by looking at the trendlines - the rate of change. The upward slope post-COVID is steeper than the upward slope pre-COVID, and since there isn't a huge difference in pre- and post-COVID trends in GDP, wages, or population... well...
If the population is increasing, it should be going up, regardless. But a large part of what you're showing is the effect of the free COVID money from the federal gov't.
https://fred.stlouisfed.org/graph/?g=1dQbS
Did folks with lots of cc debt used some of their stimulus checks to pay it down in 2020/2021?
The data ARE pretty volatile. Ergo ipso facto libtard lies whoooo MAGA!
And more seriously, trying to draw conclusions from "trends" since the start of the pandemic is ... well, it certainly pays a lot of people's salaries, but *I* wouldn't want to put my name to a paper like that without a LOT of caveats.
I see article after article on public debt these days, but private debt is what to watch. Public debts can always be paid by money printing. Private debtors don't have that privilege.
Revolving consumer debt in the US had reached about 4.7% of GDP by the middle of last year, or about what it was in the mid 1990s. It approached 7% of GDP at the onset of the last two recessions prior to 2020's brief covid downturn.
This number rose remorselessly over the long term staring in the early 1980s (more than trebling), before peaking just as we entered the Great Recession.
https://fred.stlouisfed.org/graph/?g=85D8
Perhaps Deliquency rates would be a better metric to determine if credit card balances are troublesome. FRED says they are back to pre-pandemic rates, but still historically low. I'd say: Worth watching:
https://fred.stlouisfed.org/series/DRCCLACBS