
I'll keep my griping short today. Here is the Wall Street Journal on holiday shopping:
American consumers spent at a brisk pace over the shopping season, as an early rush to stores amid worries about supply and delivery problems muted the effects of a Covid-19 surge that disrupted some businesses and crimped spending before Christmas.
U.S. retail sales rose 8.5% between Nov. 1 and Christmas Eve compared with the same period last year....That is the strongest growth in 17 years.
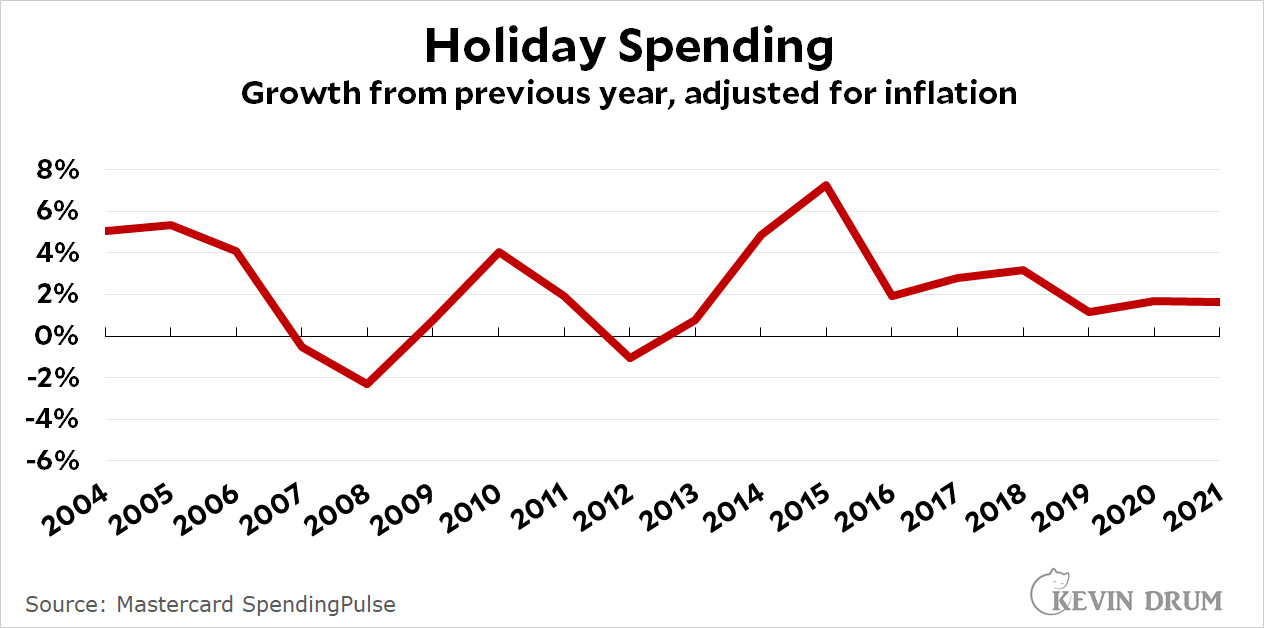
Just stop it. This gives the impression of a strong surge in holiday spending, but adjusted for inflation it's an increase over last year of only 1.7%. That's very much not the strongest spending in 17 years. It's the strongest spending since . . . last year. And 2018. And 2017, 2016, 2015, and 2014.
 If you scroll down to the 7th paragraph, there's an acknowledgment that "Some of the rising sales were due to higher prices." But that's it.
Come on, folks. You can do better than this.
At The NY Times….
Retail sales in the United States jumped nearly 11 percent this season compared with the holiday period in 2019, the year before the pandemic upended the global economy, according to a report Mastercard published on Sunday.
????
A strange graph. The inflection points on the curve do not agree with the years on the scale. And the intervals on the scale are sometimes one year, sometimes two.
WSJ is quoted as writing:
Kevin responds with:
There seems to be "growth" missing in Kevin's response.
While it still wouldn't be the strongest growth, why isn't Kevin adjusting the "clearly a result of explicit actions against COVID" growth of 2020 the way he was adjusting inflation figures earlier when he was saying a two year outlook should be applied?
On a more prosaic note, the x-axis tic marks do not seem to correspond to where the inflection points on the line appear. It is as if they are at a different cadence than the data being plotted.
It would be nice if Kevin would include specific links to his source data.
And... for what it is worth, the WSJ seems to be reporting on figures reported by MasterCard: https://www.mastercard.com/news/press/2021/december/mastercard-spendingpulse-u-s-retail-sales-grew-8-5-this-holiday-season/
I went ahead and asked the contact person listed therein, who very kindly and promptly replied to say that no, those figures are not inflation-adjusted.
It is somewhat surprising that , with Xmas shopping season last year happening right when the bad first winter wave was hitting, that spending was not significantly down.
I'm struggling with thinking of how the lack of supply chain issues and any increase of sales is somehow being sold as a Biden failure, yet I know somehow, somewhere all this is being pitched that way.
Well, I suspect that many of the reports that come out will be wrong
A - they counted sames since Nov 1. IIRC in the past they went from Thanksgiving week until Christmas. That morphed into Nov 15. Now it's Nov 1.. Most retail workers get their Christmas shopping done before Nov 1. Keep in mind that orders for Christmas goods go out in April May and this year was a real crap shoot as to what shipped, and when.
B - One thing retailers did NOT want was midnight madness on Thanksgiving evening. THAT PART has been cut way back, Given the rudeness of people today from COVID fatique I wouldn't want to be anywhere near a retailer during holiday shopping but from all the anecdotal accounts I have heard it wasn't all that bad.
Overall not a bad sign but I do think the worst of Omicron still lies in front of us. Already 2 football bowl games have had one of the teams drop out due to COVID. NFL football is topsy turvy with teams missing star players from week to week. NBA stars out due to COVID.
Its going to be another bizarre year
Out of curiosity, was the 6.9% inflation rate true for all products?
If we take out inflation for energy, and food what was the inflation rate?
It looks like it was 4.9% or so:
- https://www.cnbc.com/2021/12/10/consumer-price-index-november-2021.html
which still includes the high inflation rate for cars.
Meaning that inflation adjusted shopping growth for Christmas was perhaps 3.6% which based on your graph is higher than between 2016 and 2020 (possibly excluding 2018) , which seems like a quite respectable growth rate.
Perhaps I am missing something.
Good comment. Kevin makes a mistake when he tries to adjust nominal retail sales by the overall inflation rate to calculate inflation adjusted retail sales.
Real (inflation adjusted) statistics are useful....but they are also very likely to create a misleading picture as in this example.
If your bacon, gas, and cars cost more, everything is going to hell. It's just common sense.
????????????????
Hmm, you give gas for Christmas?
Bacon is under the tree?
Perhaps one gives cars, but cars are not typically under most trees.
As an alumnus of a couple of large retail companies, I can tell you that raw percentage increases, unadjusted for inflation, are typical measures in the industry. If you follow retail stocks, you'll see year-over-year revenue increases reported as a key metric of performance.
I’m usually with Kevin on these things, and no doubt the article leaves a lot to be desired. But from the brief snippet provided, my impression is part of the point of the article is that deamand-driven inflation is a problem. So nominal figures might be appropriate, no?