
Here's an interesting chart for inflation in goods:
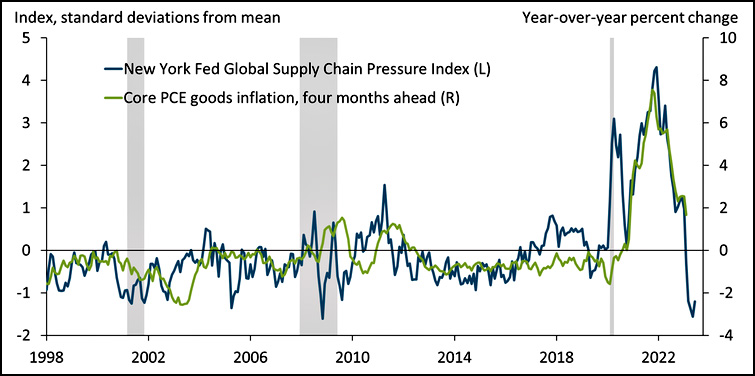
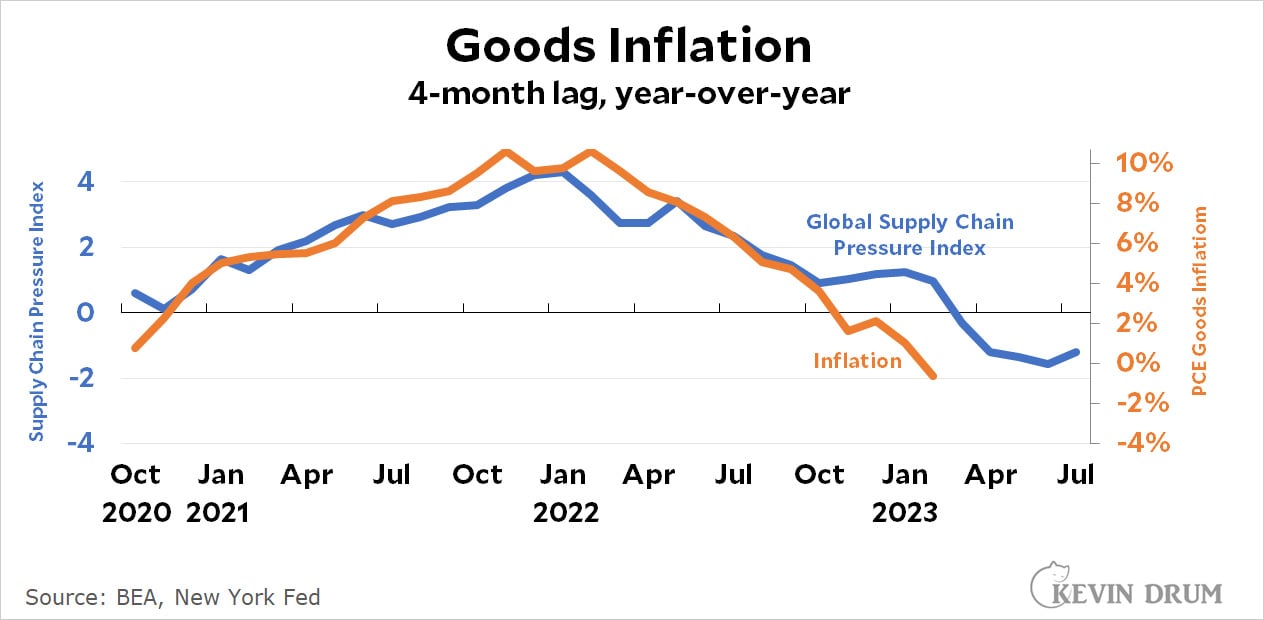 With a 4-month lag, the New York Fed's supply chain index predicts inflation in goods pretty accurately. The Kansas City Fed says the prediction is even more accurate if you use core inflation:
 This is intriguing both for the closeness of fit and because it strongly suggests that inflation in goods during the pandemic was all about supply chain shortages and nothing else.
It is unserious to claim that inflation is about "supply chain shortages and nothing else."
Inflation is always about many things.
Not every good was impacted by supply chain shortages, and yet we saw fairly broad increases in the price level.
If producers raise prices, will consumers pay them or change their consumption habits? We saw inflation even in goods and services that have fairly strong price elasticity of demand.
If supply chain shortages alone have this much impact on the price level, why didn't that happen with the first spike in supply chain shortages at the onset of Covid? Or in 2018, when supply chain pressures rose but prices remained low?
Supply chain shortages absolutely contributed to inflation, but other conditions had to exist to allow that inflation to be realized. It is never all about one thing and nothing else.
Kevin perhaps overstates things a bit by claiming that the 2021-22 inflation was really a fallout of supply-chain issues and "nothing else." *Of course* anything this big and complex has multiple factors. But I think the argument we can put to bed with this is the notion that all the inflation was caused by emergency pandemic payments and young bucks running out and blowing all their windfall welfare checks on steaks and the like. We forget how much, for example, China's zero-Covid policy roiled supply chains, or how coming out of the lockdowns caused a huge spike in oil prices and container shipping costs. Add to that a huge bird flu pandemic that decimated poultry farms across the US and you had a classic (mostly) supply-chain-caused inflation spike.
That’s just how aggregated measures like CPI or PCE work. That’s why some measures leave out volatile categories like food, energy or housing — because they have strong effects on the aggregate. Nobody publishes measures of price variations across product/service categories. Oh, actually, Kevin has: https://jabberwocking.com/the-price-of-bacon-is-up-8-1/
Youve participated in the conversations on this topic enough to know that Kevin and virtually everyone knows this.
This is an unsuccessful strawman attempt.
Your first chart shows movement from disinflation into deflation. At what point will the Fed counteract deflation with lower rates? If they do this without a recession, will you officially call it a successful soft landing?
ᕕ(ᐛ)ᕗ . . . [̲̅$̲̅(̲̅ ͡° ͜ʖ ͡°̲̅)̲̅$̲̅]
If there is no recession that does not prove in any way that the Fed was in control at any time. Even if there is a recession that will not prove that the Fed did it, although it will be the number one suspect.
I would tend to agree with what you're saying, but I'm not saying that the Fed is/was in control. (We can have a different argument on the scale of its finger-pressing with regards to its balance sheet, however.)
The premise is KD's long-held assertion that the Fed should not be raising rates because it will trigger a recession (any day, now).
Therefore, if the Fed starts lowering rates, it would suffice that KD would believe that the inverse situation is then also true -- that the economy has hit the bottom (whether or not it entered recession).
The prices of oil and gas were big parts of the inflation - are they "supply-chain"?
The pandemic and the Ukraine war both affected things at the same time.
As closely related those two lines may have been, they certainly seem to have diverged circa October 2022…
certainly appears to be correcting in the months following Oct, doesnt it? 1 or 2 months out of 2 years still seems like a pretty good match.