
I have no idea why I did this. I was just curious what the latest American Time Use Survey¹ showed about the difference in activities between working-age men and women. [Clarification: That is, this chart shows how many more minutes men spend on each activity compared to women.] Here it is:
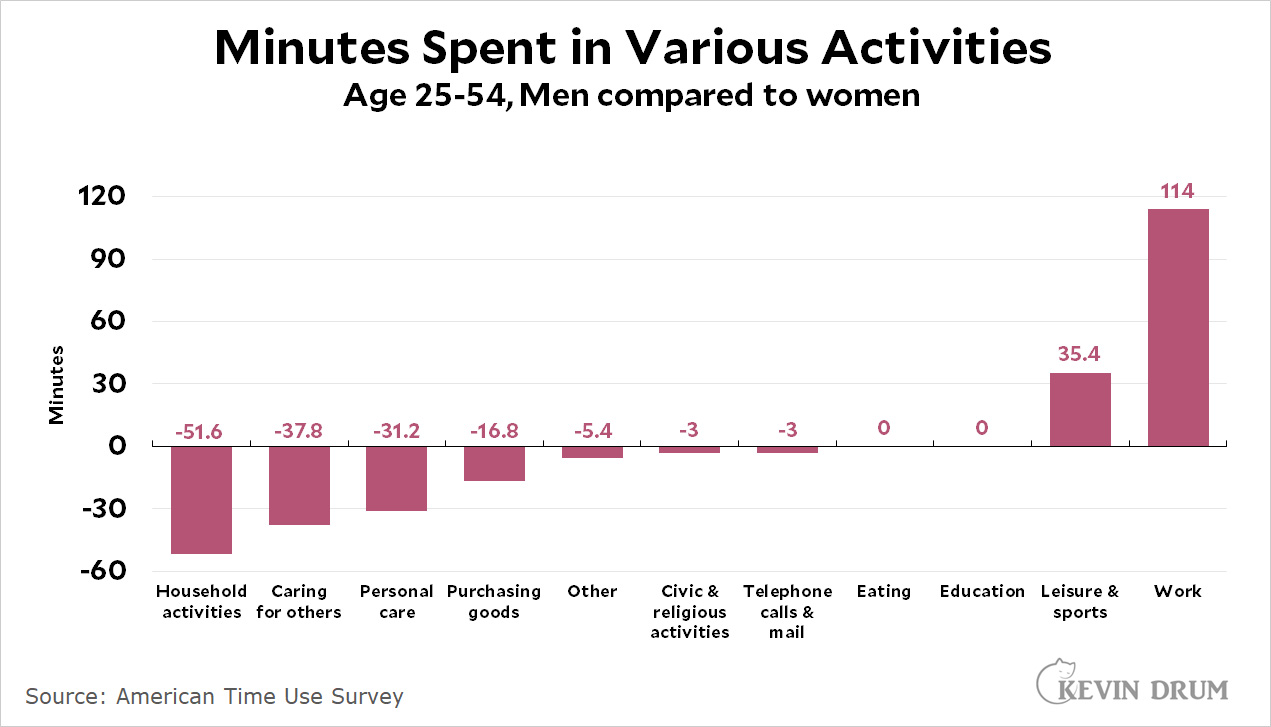 On average, working-age men spend 114 minutes more at paid market work than working-age women. They also spend 35 minutes more on sports and leisure. Women spend more time on practically everything else.
By the way, sleeping is recorded as part of "personal care." Among the working aged, women sleep about 18 minutes more than men.
¹2019, so pre-pandemic
In which category do "watching netflix," "going down Youtube rabbitholes," "doomscrolling Twitter," and "posting whacko memes on Facebook" go in that chart?
Serious note: it isn't clear where tv/internet/cell phone time goes on there.
jnuih
When the debt bubble bursts, quite a change will come.
Tried to replicate your chart for "work" -- wanted to see trends over the decade.
Couldn't find a way to isolate just "work" by age groups. I could only drill down to age groups by "work and work-related activities". Added up series TUU10101AA01012168, TUU10101AA01012184, TUU10101AA01012185 for 25-54 men, and TUU10101AA01012284, TUU10101AA01012300, TUU10101AA01012301 for 25-54 women.
Otherwise, the "work" group was limited to age 15+. Do you have the series numbers for those age-specific "work" groups?
“Telephone calls and mail”?????
Yeah, the approximate time spent on that for men and women would be 0 minutes and 0 minutes. Come on.
I don't read the chart to mean "the amount of time spent on these activities," rather, "the difference in amount of time spent on these activities." So, perhaps men spend three minutes per day, on average, on calls/mail and women spend zero? 🙂
Like they say, it's good to be King.