The Wall Street Journal is worried that high savings levels might sustain inflation for a long time. Let's take a look:
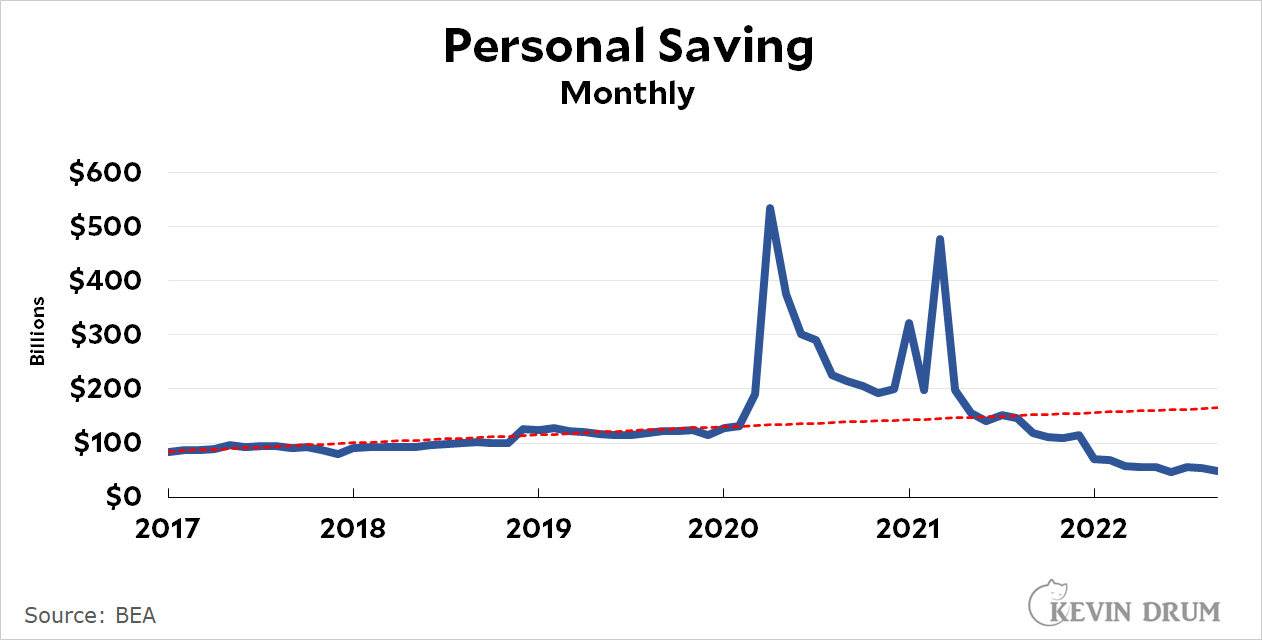 The red line shows the trend of savings levels. There are three spikes that coincide with three different stimulus packages, and during those spikes savings are above the trendline. This means families are saving more than they ordinarily would. But in mid-2021 savings go below the trendline, which means families are spending down their savings.
It's easy enough to calculate the monthly excess and see how it accumulates over time:
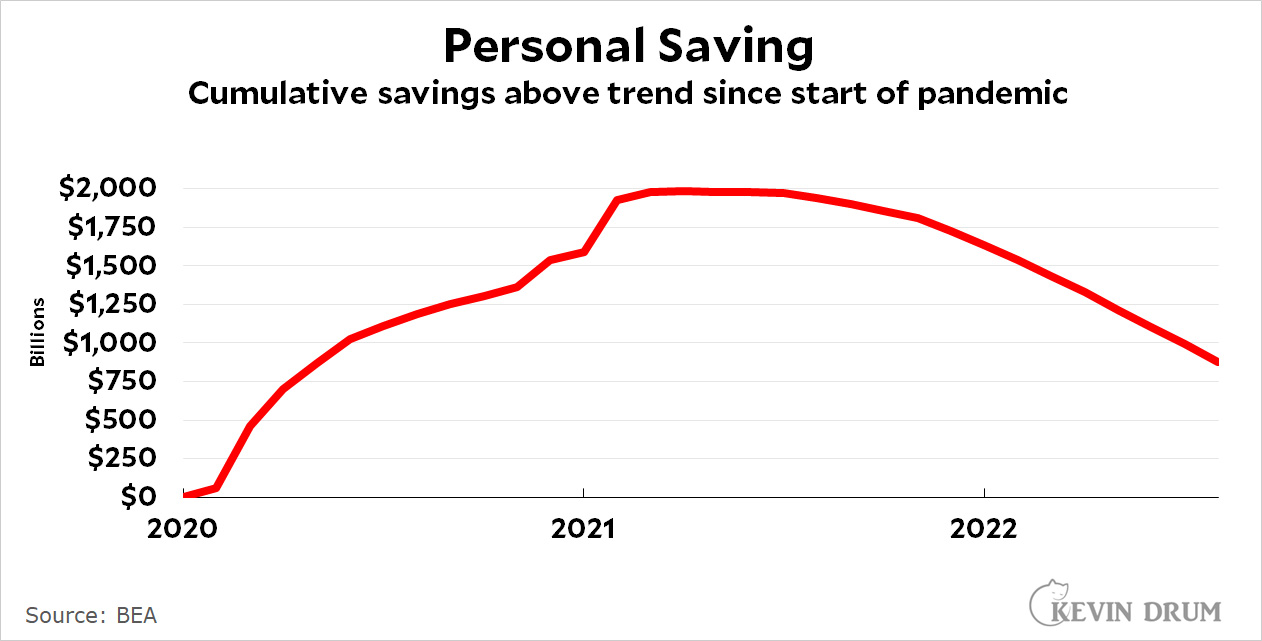 Savings above normal peaked at about $2 trillion, but families have been spending that down and excess savings are now just under $1 trillion. Fed experts, using a different calculation, put the number at $1.5 trillion, of which $350 billion belongs to non-rich people who might actually spend it. That's about 2% of our total spending of $17 trillion per year.
Will this excess savings prolong excess spending and therefore sustain high inflation rates beyond the end of the year? Maybe! But I wonder if it's even worth looking at this. Why not just look at this?
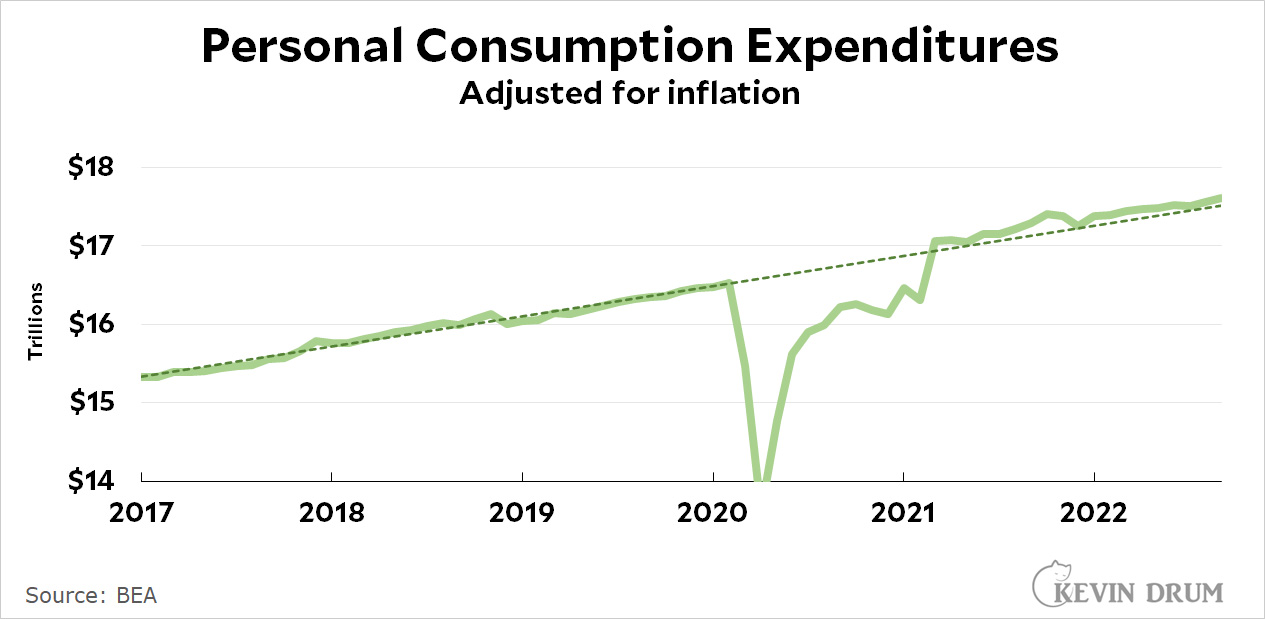 Regardless of where income is coming from or how high it is, what you care about in the end is whether people are spending at high rates. If they are, that might sustain inflation.
But they aren't. Spending is right on trendline, neither up nor down from normal. Without doing any complicated calculations that add up different sources of income and debt and consumer confidence and so forth—and then tossing in some complicated calculations about what motivates people and how they decide to spend money—you can put it all away in a black box and just see if they are, in fact, spending money.
The Fed would surely prefer it if people were reducing their spending, since this would slow the economy. That's not happening. But neither is spending accelerating, which would certainly give inflation a push. In reality, nothing is happening. Spending is normal and has been since last December. If you're looking for something to justify high interest rates, you're going to have to look elsewhere.
Well people are going to reduce their spending and their savings when we finally get the recession the Fed and powers that be crave. And we will most likely have a GOP supermajority to go along with it.
Since November of 2021, there has been at least 1.7 job openings per unemployed persons -- per September BLS JOLTS -- but to the point, it actually increased in September, roughly 2 job openings per unemployed persons.
That's quite remarkable. Aside from housing construction, generally, employers are ignoring the Fed's actions to raise the core rate.
This seems like one of those cases where adjusting for inflation is not the best approach.
Suppose excess spending was driving inflation, so you have 8% increase in nominal spending and 8% inflation. You would see a spike in the inflation chart and the nominal spending chart.
But if you look at the adjusted spending, then the two spikes cancel each other out. You would see a flat line in inflation adjusted spending.
I believe that all of these charts are misleading.
Personal Savings - I believe that these charts do not include actual savings, instead they are the result of: Personal income (excluding capital gains) - taxes ( including capital gains tax) - consumption spending. Any time there are large capital gains, this stat stops giving meaningful information.
Personal Consumption Expenditures - As this chart is adjusted for inflation, it can't be used to argue that nominal spending isn't taking off. Arguing that spending is not taking off if we adjust spending by the rate if inflation cannot be used as an argument to say that spending should be ignored when looking for causes of inflation. To make this argument you need to show that nominal spending isn't taking off.
Careful with CHARTZ!
The things that actually cause inflation are the things whose prices are increasing faster than other things. There have been several of these: shipping costs, computer chips, oil and gas, rents. Wages have not been keeping up with inflation since it rose - they are certainly not driving inflation. Inflation has been driven mainly by supply shortages. As you say, according to Kevin's graph consumption has been about keeping up with inflation, that is people have been buying about as much (on trend) as before the pandemic but paying more for it despite the drop in real wages. I would say that this is neutral with respect to inflation. But there was a big dip in consumption in the pandemic and recession - can't people catch up on consumption?
The attitude of many economists and economics writers as well as the directors of the Fed seems to be that uppity workers are always the cause of inflation, and if they get wage increases even equal to the increase in prices this must be put down by causing unemployment with interest rates (although many years of raises in interest rates did not prevent inflation in the 70's), and of course workers' consumption must be curtailed. In fact workers real wages have not yet risen above the level of 50 years ago. There is no reason for progressives to accept that inflation must be put down on the backs of workers instead of curtailing profits, for example.
3rd chart once again shows you that inflation is about monopoly and oligopoly power in commerce. If inflation were about demand for things, rather than the price that concentrated industries are choosing to charge (because they can get away with it), then it would be higher above the inflation-adjusted line than it is (as some portion of people would choose to spend more) and show some sign of an upward trend in there.
Otherwise, I agree with jdubs.