
The American economy gained 431,000 jobs last month. We need 90,000 new jobs just to keep up with population growth, which means that net job growth clocked in at 341,000 jobs. The headline unemployment rate fell yet again to 3.6%.
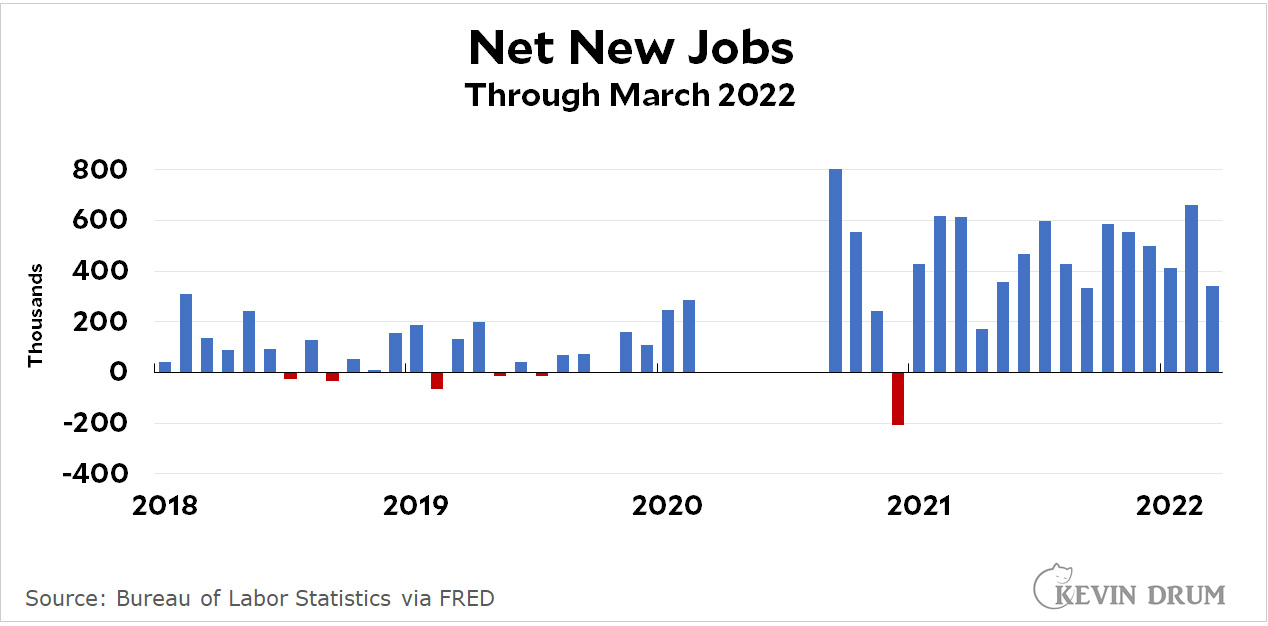 This is yet another strong jobs report. However, wage growth was terrible: adjusted for inflation, weekly earnings declined at an annualized rate of about 5%. This continues to be puzzling since (a) employers are still complaining that they can't find workers and (b) the labor market is genuinely tight. Here's the participation rate for men and women:
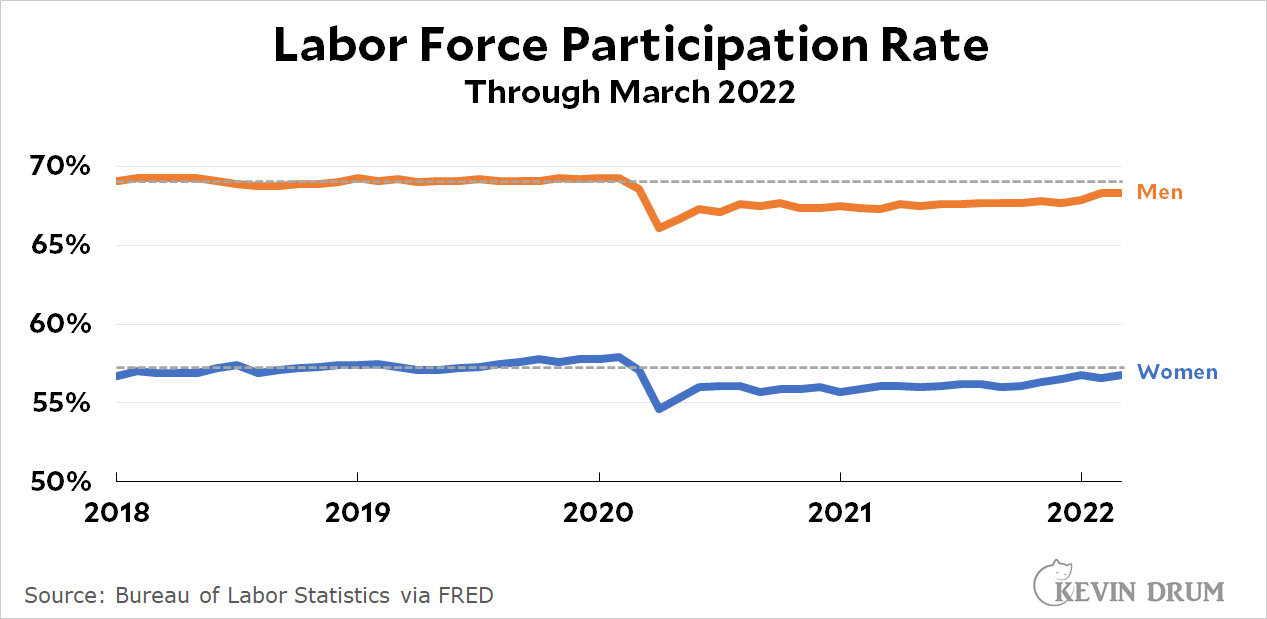 Men are within one percentage point of their pre-pandemic level and women are within a few tenths of a point. And the numbers are even better if you look at the prime working-age population:
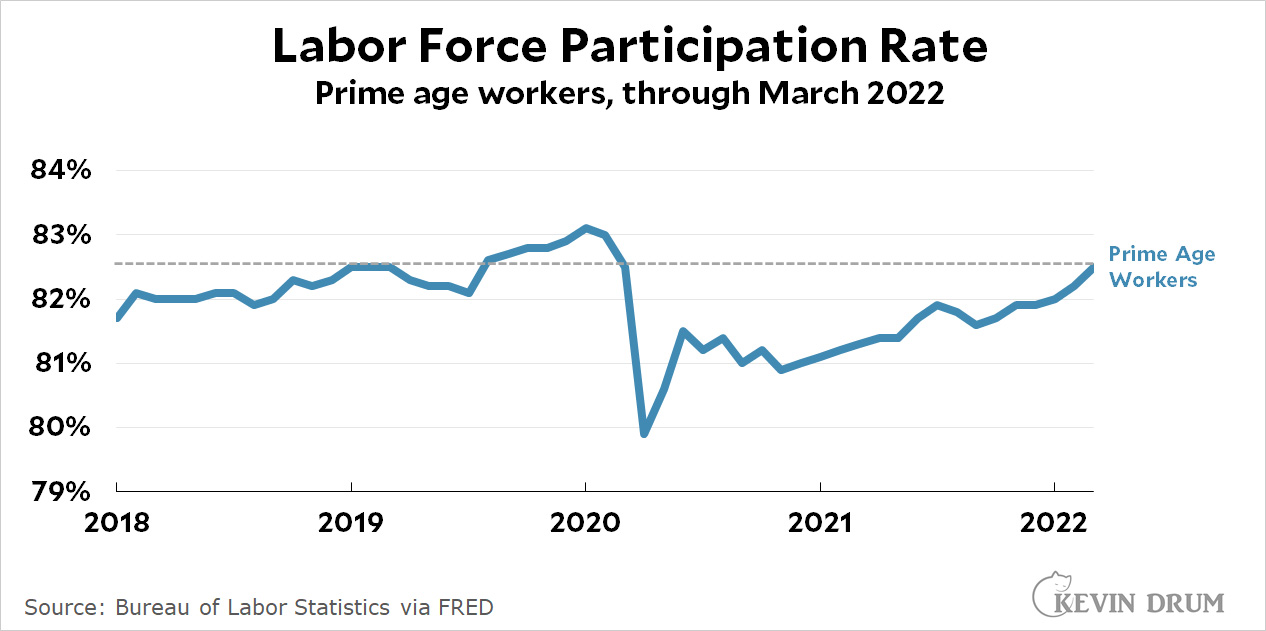 The participation rate among prime-age workers went up 0.3% in March and has all but caught up to its pre-pandemic level. This is a level at which employers should be offering higher wages to coax nonworkers into the labor force, but they aren't. So what's going on?
Well, that means bad news for the Democrats, and Joe Biden's approval ratings just fell another 5%.
Every silver lining has its dark, dark cloud.
Was it Archie or Mehitabel who said "but sometimes it takes a little longer to get it to the bank?"
Anyway, thanks for the smile - woke without alarm due to clock-radio failure, followed by power outage in entire building, so even a wry smile prompted by bitterness is something.
That s/b archy, not Archie!
A bunch of Harriman’s original drawings for those books were available for auction a couple of years ago. I actually tried bidding on a few but really I realized that the amounts they would go for were above my pay grade.
I'm guessing you're being ironic, but at this point I think continuing tightness in labor markets might well be bad news for Democrats. Which is a shame, because it's good news for workers! But it's not up to me.
Probably not.
Is this the best economy we've ever seen where so few recognized it?
Hiring is brisk, wages are up (even after inflation), stocks and home prices (assets) are up, new business formation is surging, health insurance coverage is improving, productivity rates appear to be booming....but the story of the US economy doesnt seem to take this into account.
Anecdotally it seems that almost everyone I know is doing really well while they are also certain that the economy stinks for everyone else.
Due to inflation our income fell 3%. That's not up even "after inflation"
Mismeasured wages are pretty common.
How do you calculate the "due to inflation" part as opposed to "I had more expenses"?
In my case (I keep very exact records) my overall spending, exclusive of the fact I paid off my car loan in one lump sum, were up c. $3K for the first three months of this year* while my income is up more the $5K-- mainly because I got a large bonus in February while last year my bonus was pretty small. So I belong to the "good economy despite inflation" side.
* That included some pricey vet bills, two significant out of town trips, a new desk, and some charitable contributions made with my bonus money.
Oh dear lord, tell me about those vet bills. It seems that pet insursance covers less and less these days despite purchasing a supposedly 'more premium' product. We're introducing a new (albeit elderly, and with some health problems) cat into the household four months after our Sonny passed to keep Fozzie company; the charges to make sure the match is a compatible one are through the roof (crosses fingers.)
Painfully aware, my pandemic puppy ate mulch and other assorted no-nos and ended up with a blockage that thanks to modern vet surgery was fixed but at the cost of three mortgage payments. Then my old guy had an infection or cancer, a mysterious growth in the chest area. Guy got antibiotics and chemo infusions he's back to his usual rascally self now but at the cost of about 2 mortgage payments.
Luckily I've been saving a lot of money by working from home and had a promotion at work.
Nah. Last year was terrible economically for my family. I'm in higher education and covid gutted us - pay freezes for the last 2 years. That means my income declined 7.5% last year. Meanwhile, my health insurance premiums went up as well, meaning my take-home pay actually shrank.
I always go to https://www.calculatedriskblog.com/ to check out his charts. His charts are even better than Kevin's (sorry Kevin). The one number I always check first is Employment-Population Ratio 25-54 year olds. It jumped to 80.0%! If you want to know how good that is, check out calculated risk's cart below:
https://blogger.googleusercontent.com/img/b/R29vZ2xl/AVvXsEi3pJz2-dQliA8lHc43qeS0TqdYsNAfFKciV5h_m1Rmw_MB6OZmEz0iEKLP1wm82iMXAxdrRlsyxg2_8gztvpK5F4WqEFIwlfX4qsttkgTmm6lCYt0Y-lHS1jBLsoab3yNDc43n5cp-w-53ph10fiMTz7Nb2w-VbEKsfAacgtvj9_4kPtHNDQ/s1065/EmployPop2554Mar2022.PNG
If you look at that chart, you'll see that 80% is about where expansions peak. 3 of the last 4 expansions died right after hitting it because it usually takes so long to reach that value that the expansion runs out of steam when it finally gets there. When the year started I thought we'd probably reach 80% by the end of the year, but we hit it in March! Damn!
If I had to guess I'd say that it continued growing so fast because a lot of people are no longer afraid of Covid and are going back to work. But that's just a guess. Maybe it's because people are being offered more money and that isn't showing in the statistics for some reason. It is still great to see.
I wonder if big bonuses are creating "Shadow" wages. Honda is offering contingent workers 3000 after 3 months work. Full time employees 5000. Nice chunk of change.
How do we know that employers aren't offering increased wages to lure workers but just aren't getting anyone worth hiring? Anecdotally, that is part of the problem we are facing. The pandemic shutdowns gave a lot of people time to ponder their work choices, and with many jobs available a lot of people switched to better positions, with or without increased pay. A lot of the jobs that are going unfilled are at the low-end of the scale, and then others require skills or qualifications that just aren't quick to come. There's lots of friction between just offering higher wages and then getting those jobs filled.
If I remember Economics 101, there's a solution to a shortage of any of the Factors of Production. Let's see, for a shortage Capital it's higher interest, for a a shortage of Land (i.e. all material factors of production) it's higher prices for inputs, for Labor it's....
Seems to me that job losses originated with Covid, but that meant professional workers stayed employed by using Zoom, so most lower income workers were laid off. Thus as employment increases occur, they are likely dominated by low income workers returning to work. Thus the decline in average wages is a consequence of higher income workers who Zoomed being offset by lower income workers being those who show up in the statistics.
Kevin states "This is a level at which employers should be offering higher wages to coax nonworkers into the labor force, but they aren't. "
Wages are sticky. If a company is not confident about the future, its logistical to not be aggressive in your hiring/and or compensation policies....
ugh...no edit function
it LOGICAL (not logistical)
I'm sure an actual economist has already done this, but every time I see Kevin's charts I wonder if anyone ever does an inflation chart broken down by things people have to buy as opposed to optional buys.
I mean, food is a must buy. Gasoline is basically a must buy. Electricity and water are must buys, although I don't know if those are in most calculations.
Although shelter is a must buy, rents and value of real properties are not the same as food. The effect of increase in the cost to buy housing is not, at all levels, that people pay more. They pay more if they chose to pay more (rents increases are sort of up to the landlord and vary by contract), otherwise, in the case of buying, they buy less. Obviously, homelessness is hugely effected by rents.
Cars, on the other hand, seem like, if you have had a few cups of coffee, should not be in the same category as food. Buy a car, or don't, buy a used one. Whatever.
The same with most durable goods. The older I get I mean, frankly virtually everything I buy is optional when you get down to it.
It almost seems like these inflation numbers fail to acknowledge capitalism.
KD-
Your last chart is misleading as it measures PRIME AGE which are those workers up to the age of 54. If you had a LOAD of 60+ year olds retiring then the "rate" at which Prime age workers replace them would be higher due to MORE jobs available for less workers, as those who are 50+ years old are post boomers.
The economy is great but when you consider the peak age of the boomer work force happened during Reagan and Clinton and the sheer numbers of jobs they created FOR THOSE WORKERS - you can see what has happened. We have demand for goods returning to normal with less workers able to produce those goods. Demand will decrease when the boomers are gone, of course. The question THEN will be will demand be MORE than supply?
We are going through an adjustment..............