How's the housing market doing? There are two good measures: (a) total home sales and (b) mortgage applications. Here they are:
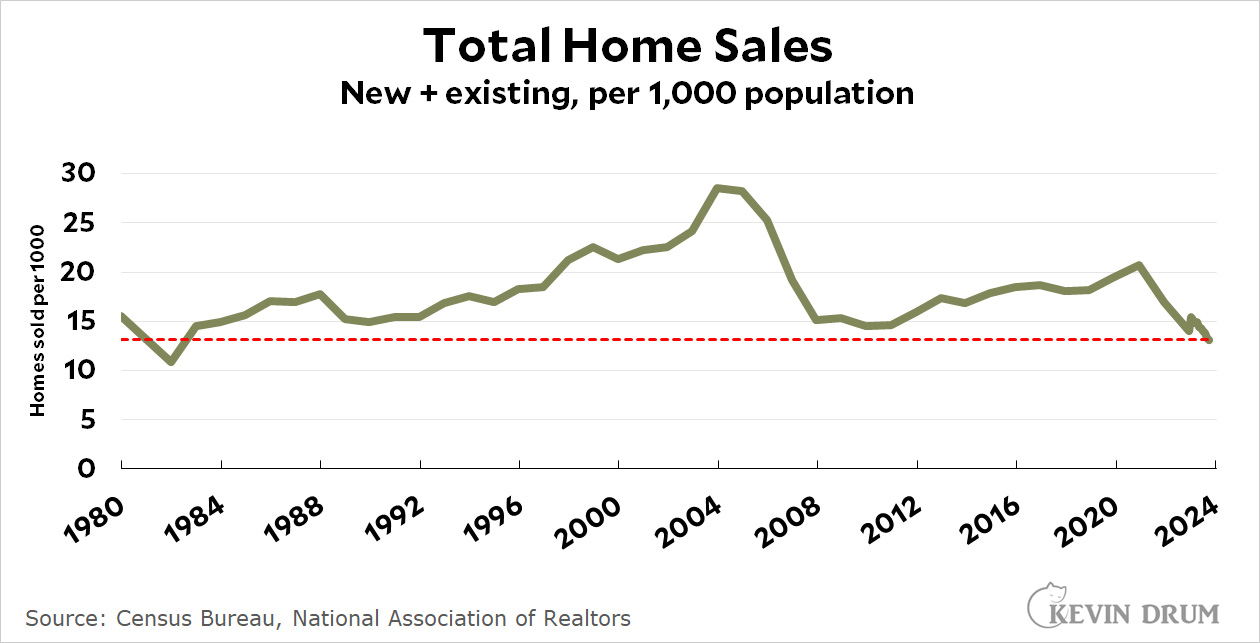
 The top chart is home sales adjusted for population. It shows total home sales at the lowest level since the depths of the 1981-82 recession.
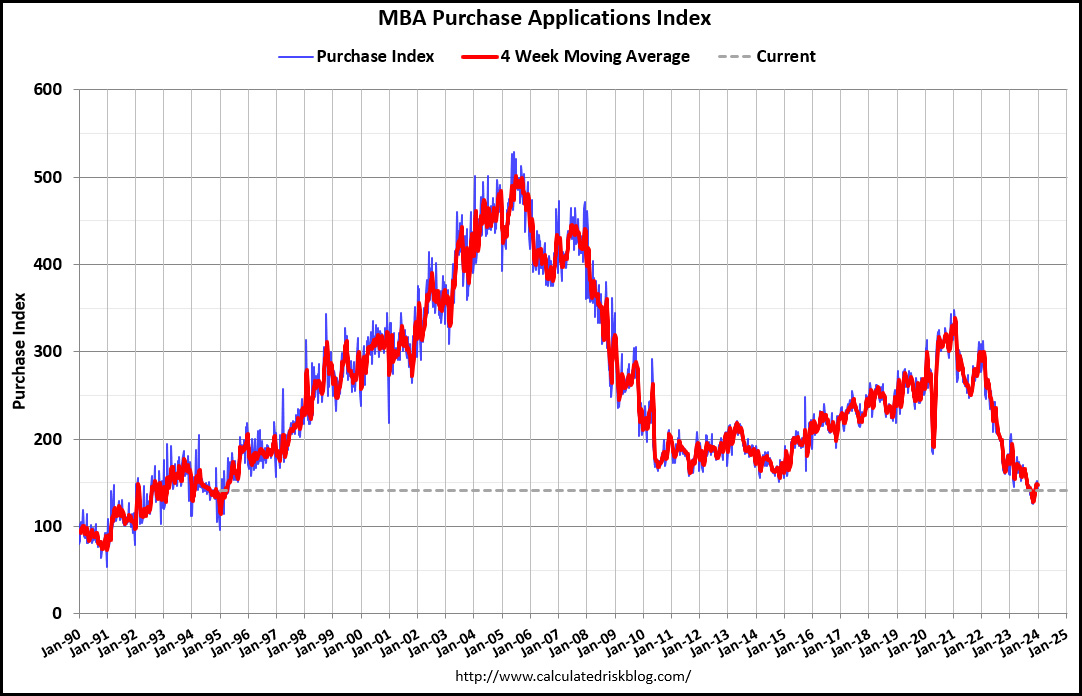
The bottom chart is unadjusted raw numbers for mortgage applications, and it shows they've dropped to their lowest level since 1995. If it were adjusted for population it would be very similar to the top chart.
So both measures agree: Home sales have dropped to lows we haven't seen for three or four decades.
This is how high interest rates slow down the economy. Housing is a huge part of the economy.
Incidentally, I bought my first house in 1981, and the interest on the loan was 14.5%. It was supportable at the time, but two years later, when I lost my job and could not find another one which paid as much, that rate became very hard to take. A sensible person would have bailed on that house.
(I may be misremembering the exact year, although I do think it was 1981, but I won't ever forget that rate.)
Sure, volume is important, but you need to contextualize the data with the Fed rate.
Right after the Great Recession rates were at zero. At the start of your chart, it was 8.23%. At the peak in your chart, the rate was 1.00%.
Right now, the effective rate is 5.33% and has hit peak. We are doing quite well, all things considered.
Tell us again how fed rate hikes have had no impact on the economy yet.
Interestingly, new home construction hasnt rolled over and declined as it did following the 2005 peak in home sales.
This part of the housing market has a much bigger impact on the overall economy than house sales.