
Donald Luskin writes in the Wall Street Journal today that inflation is going to take care of itself and there's no need for the Fed to touch off a recession in order to rein it in. Luskin's argument is that inflation is caused by an increase in the money supply—three huge stimulus bills in this case—but the effect takes about a year to show up. If you compare CPI core inflation to the M2 money supply a year earlier, here's what you get:
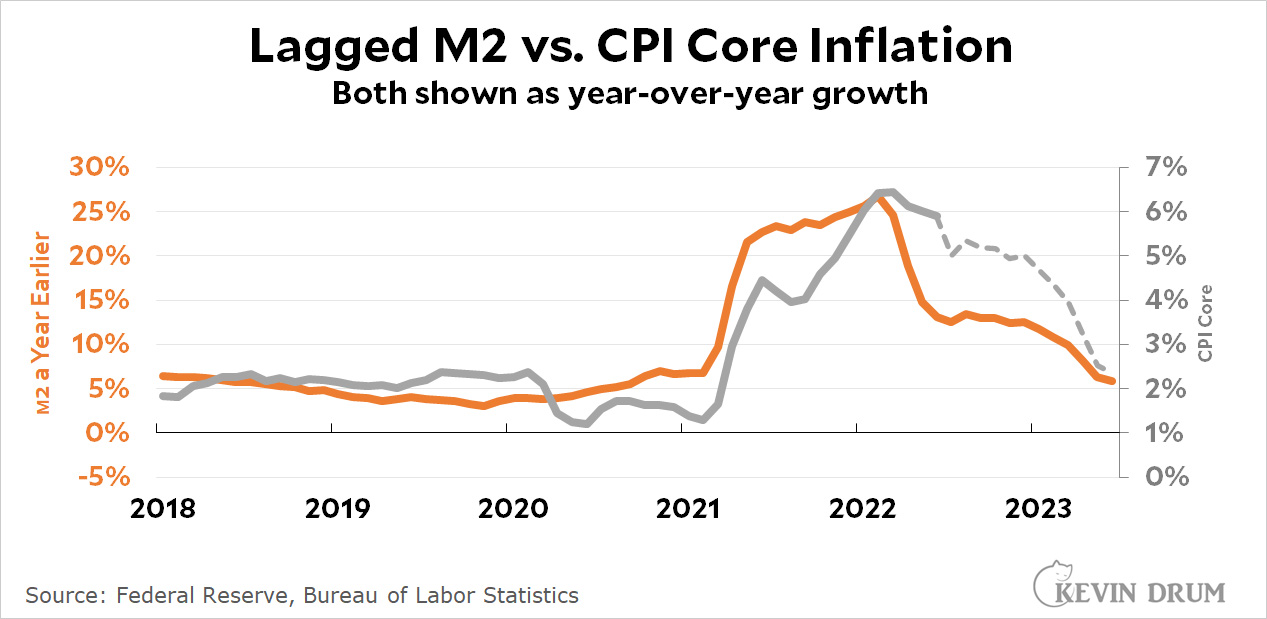 That's a reasonable fit, and the dashed line shows what Luskin thinks will happen to inflation based on what's happening to the money supply right now. By the middle of next year, core CPI will be down to 2% and nobody has to lose their job to make it happen.
I really want to believe this. There are two problems: (a) Luskin is never right about anything, and (b) he's using year-over-year inflation, which just doesn't seem to right to me. Here's what his chart looks like if you compare the monthly change in inflation to the monthly change in lagged M2:
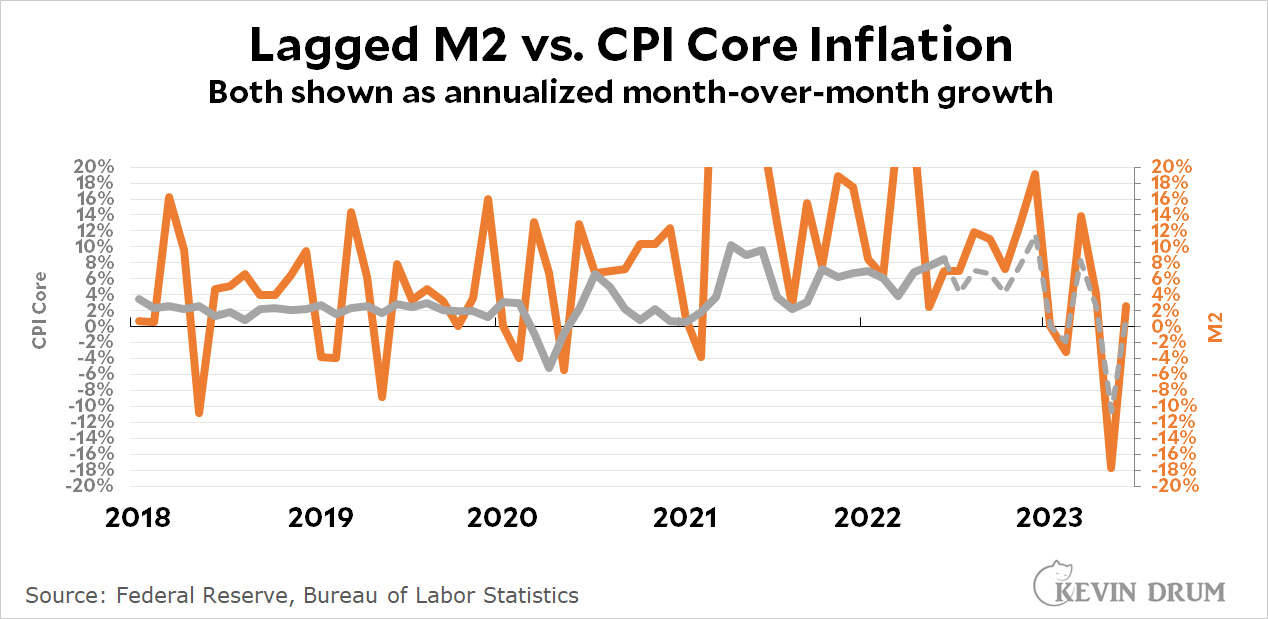 That's . . . not so good.
This is one of those times when I wish I had a better understanding of this stuff. Year-over-year inflation seems like a bad choice to me, but I don't quite know why. Maybe some really sharp monetary economist would like to chime in on this. I'd really like to believe Luskin's argument, since it fits my biases perfectly, but I'm just not sure I do.
M2 is a very narrow definition of money. I would like to see a chart with M3. Also, did the other industrialized nation have similar COVID stimulus programs. I saw a chart that showed M2 reflecting 20% of MS in the middle of 2020. It is 6% now. The historical average is 7%. One thing we can conclude is that M2 has gone down to normalcy as the stimulus has waned.
Feds don't track M3 anymore.
There was an enormous increase in both M1 and M2 because of the stimulus actions. This may have been because of actions by both Congress and the Fed. The scale of this has not been seen since the World Wars. What happened to inflation in WW II is complicated because of rationing and other anti-inflation steps, but inflation did come down at the end of WW I at the same time as M2 growth. It is very encouraging that M2 growth has dropped off, but this is not something that anyone can be making solid predictions on. Other factors are involved - supply issues and oil price.
As you pointed out before, month to month data certainly is bouncy. The year over year data amounts to a 12 month running sum, so that does smooth things out a bit.
Yeah, it does. And if money supply changes really take a year to show up in the price index, it doesn't seem likely that it would be a tight enough correlation to look like a close match in the month-on-month figures. That chart cries out for smoothing.
regardless of the US economy there is inflation globally. maybe just oil and supply chain but still how can it be addressed by just the US government spending?
A general observation - MMT has really helped me understand some of this stuff. In particular, contra Luskin and others, it isn't money supply that moves prices, it's spending. Obviously those are related but not synonymous.
David Hume observed in 1752 or so that "if the coin be locked up in chests its effect on prices is the same as if it were annihilated." ("Of Money")
MMT has no particularly useful insight, the concept of Velocity of Money - the actual technical economic analytical category has been a component of inflation analysis for literally decades: https://www.investopedia.com/terms/v/velocity.asp
What about massive tax cuts increasing spending? Not just stimulus bills. Remember when the TFG tax cuts were going to "supercharge" the economy? Maybe they did.
They supercharged the stock market, drove up "rent seeking", and probably lead to consolidations....
How does someone as perpetually wrong as Luskin still get a column in the WSJ? I guess we know the answer to that. But in any case, this is another case of right-wing inflation hawks moving the goalposts so that they can claim their dire warnings about fiscal stimulus (i.e. any policy that possibly helps poor people) were correct. Luskin may be right here about inflation gradually tapering off this year and next, but for the wrong reasons, of course. How can you point only to money supply w/o noting, I don't know, a global pandemic and its impact on labor and supply chains? People spent their stimulus savings a year ago. If you're still on about that, it's time to find a new line of work.
Their dire warnings were correct. This time.
As it happens the pile of stimulus factors were indeed too much. Which is an entirely reasonable error to make given the enormous unknowns.
The appropriate lesson is not, however, to deny they were this time correct - nor as the Left has been trying for the past year and half to deny then minimise and poo-poo inflation, but rather to allow for an appropriate adjustment. Rather than engage in increasingly desperate denialism which simply undermines credibility for the future, earlier adjustment.
Rather like if once on starting from stop one overguns the gas, the lesson is neither to never accelerate from Stop nor is it to deny one over-gunned, but simply to adjust.
The problem with the inflation will get better by itself theory is that a system can have more than one equilibrium. We were in a low inflation equibrium but the system may also have had a high inflation equilibrium, If so and if we have knocked ourselves into high inflation equilibrium then inflation won't get better by itself. We will have to knock ourselves out of the high inflation equilibrium and back into the low inflation equilibrium. This may be the Fed's view.
Lots of assumptions here, including that the economy (any economy) ever persists in a state of equilibrium.
How do you explain global inflation based on changes in the U.S. money supply?
We sneeze, the world catches a cold....
We've had money to spend, so that drives costs up for everyone. Not to mention, after lockdowns, everyone wanted to fix up their house or upgrade their TV and PC.
Curiously, I have never seen any data establishing that stimulus money was expansionary. The ‘economic impact payouts’ were introduced to replace income and spending lost due to pandemic-caused layoffs and business closures or restrictions. Did those those payments net out to an increase, decrease, or a wash, in terms of actual spending over the last 2+ years?
I've never seen that either, but it is an article of faith throughout the financial & economic pundit world that anything done for people is inflationary, bad, and doesn't work anyway.
You got it!
Changes in the world reserve currency will do that. Golack’s metaphor seems fitting to me
Blame Bretton-Woods
I don't see much of a connection between lagged M2 and inflation. In 2018, inflation rises even though the change in M2 falls. The same thing happens in 2019. In 2020, we have the reverse with inflation down but M2 up. Finally, in 2021 we get a match: both inflation and M2 are up. Looking at 50 years of data yields the same conclusion: If there is a connection between inflation and lagged M2, it's not a strong enough one that you can spot it just by looking at a graph.
I believe (although I am not an economist and haven't studied the issue carefully) that M2 is one of the factors that affects inflation, and that therefore is one of the things that you should look at if you are trying to predict future inflation. But the idea that you can predict inflation solely by looking at M2 and nothing else is obviously false. If Luskin is claiming otherwise, it shows he is still worthy of his “stupidest man alive” award.
The problem with EVERYONE who pretends that money supply causes inflation is that we had a massive increase in money supply during and after the 2008 recession and didn't get any inflation.
Yes, the recent increase was far bigger than a dozen years ago but the increase in money supply was bigger in 2008 than anything we had ever seen before.
They were wrong then and they are wrong now.
If gas went DOWN by 5% in the last month then what will that do to July inflation?
TIPS is showing less than 2.4% average inflation for the next 10 years. that means inflation better get below 3% very quickly.
Monetary supply is, for the common conservative, the definition of inflation. Of course a conservative will point to M2 and in the same breath talk about the effects of headline inflation, which more or less indicates the limits of their cognitive abilities.
I have a different point to make. M2 velocity: https://fred.stlouisfed.org/graph/?g=Qngk
For the last 15+ years I have pointedly noted that the dollar is nowhere as productive as it could be, and that the conservative trickle-down tax policy hasn't just failed us, but that it is leading this country to economic collapse.
Kevin badly misrepresents things by cutting his monthly graph off at 20%. Look at the complete graph at FRED:
https://fred.stlouisfed.org/graph/?g=SdsR
which actually shows the big jump starting in March 2020. After that growth was much less and finally it has turned down in the last few months.
The year/year inflation number is a smoothing of the month/month numbers - it is an average over the last year. As I have mentioned before, averaging, as in the year/year inflation number, can give a distorted view when there is a one-time jump. In such a case the year/year number shows a kind of spurious plateau, which is in Lusk's graph. This is true for any period of averaging. Sometimes you can get a clearer understanding of what is happening by looking directly at the raw numbers, not the monthly or yearly growth rates.
So actually the big drop in M2 growth came in the middle of 2020. But the real question is whether all the money from this has been spent. The different ways of graphing this do not answer this question, but you can get onto a wrong path by looking at the wrong ones - or incomplete ones.
The difference between month over month inflation and year over year inflation is that the former has a higher noise to signal ratio. Mathematically, year over year inflation is just the product of the last twelve months of month over month inflation. It's roughly like the difference between the daily COVID death count as opposed to a thirty day moving average.Everyone is just as dead, but the daily count is full of reporting artifacts.
What measure of inflation should you look at to make policy decisions? It depends on what you are using it for. If you are the Federal reserve with a blunt, slow acting tool like being able to set the prime interest rate which indirectly affects major then minor lending institutions and then businesses and individuals who generally have multi-month or even multi-year credit terms, you want a metric with a time scale similar to your speed of action. One year makes sense, though I can imagine arguments for six months or perhaps a time weighted metric. If you are steering an oil tanker, you don't need to compensate for every wave as one would do in a rowboat.
On the other hand, this is Luskin. Could the blind squirrel have found a nut this time?
People should also remember that inflation is how a growing economy signals resource allocation. We have had a growth depressed economy since 2008, intentionally so as to avoid inflation. Then came the rapid COVID slow down. The stimulus let the recovery from this setback take place quickly, so inflation was inevitable. We could have simply let the COVID recovery drag on for a decade by not supplying adequate stimulus and raising interest rates at the slightest sign of economic growth just the way we did for the Great Recession. We didn't.
Think of inflation as the current across a capacitor. The current only flows when the voltage is increasing or decreasing. If you want to raise the voltage, you have to accept the current flow. Who says differential equations aren't useful in real life?