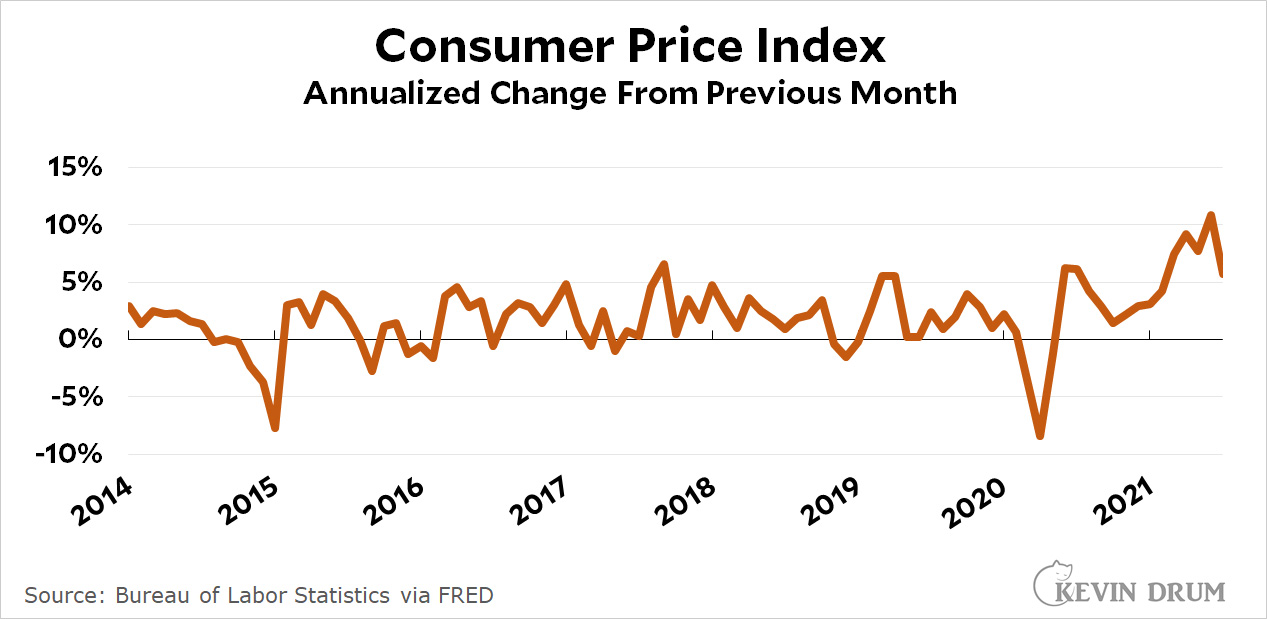
Inflation in July remained high at 5.4%, largely due to huge increases in the cost of gasoline and used cars. However, the increase from the previous month was much lower than in June:

The inflation rate for food remained pretty reasonable at 2.6%. Whatever people may say, a trip to the supermarket just isn't a lot more expensive than it was a year ago.

"The inflation rate for food remained pretty reasonable at 2.6%."
With the usual caveat that mileage may vary in your part of the country.
Also--people and especially politicians looking to score points only talk about the one or two items that have jumped in price.
But my artisanal yogurt went up 50 cents last week! Inflation is running wild.
Is it annualized change from previous month, or change relative to same month in previous year?
5.4% represents the year on year change (July 2020-July 2021). However annualized change from previous month (June 2021/July 2021) declined from .9% to .5%. Core inflation (preferred method of Fed) also declined in July.
Sorry, remove that "annualized" above. It's simple "monthly" inflation (May:June vs. June:July).
According to a study by some researchers over NBER, there was a bout of inflation during the Spanish Flu (adjusting for post WW1 demand).
Now, if there are any parallels, the next few years might very well be deflationary...
I believe it is the change from the same month last year per news reports .
Which might mean Kevin is playing games a bit as before he made a big point about that measurement being thrown off by last year pandemic distortion. So showing a chart where this number is compared to similar number for last month is distorting, if for instance the pandemic price distorting eased off from june 2020 to july 2020. Where is Kevin's handy dandy adjustments for that now? Is it because doing this now would not support his point?
The actual monthly change in prices was. .5% as reported. Depending on where it was rounded from, that should mean the annualized current rate is somewhere around 5.5% to 6.8%. Have not seem the actual figure.
Incidentally, first thing I saw on Google was a CNBC story where the headline seemed to read as if prices jumped 5.4 % just in one month. So bad!
Anyone can access the data at FRED:
https://fred.stlouisfed.org/series/CPIAUCSL
Hit the EDIT GRAPH button and you can change from year/year to month/month, etc, or in other words come up with any view you want.
So showing a chart where this number is compared to similar number for last month is distorting,
It's not in the least "distorting." Annual inflation (July this year vs July last year) was 5.4%. That number is indeed likely to be puffed up because of the subdued condition of the economy last year. However, citing the decline in monthly inflation (the June=>July increase was .5%, compared to the May=>June increase of .9%) -- your complaint to the contrary -- isn't "distorting" -- it's simply a single datapoint suggesting inflation is on the way down. It's certainly possible this dynamic won't hold in August, mind you, so I guess we'll have to see! But a decline is a decline. It's also, needless to say, consistent with the widely-held view that the increased inflation we've been experiencing of late is transitory (comparable to what happened at the end of WW2).
Kevin gets it right this time, using primarily the month/month number as I have been recommending. But you need to look at the whole history, not just pick out a single number or average. And predicting inflation in the future requires looking at what exactly is causing it now. Krugman's twitter posts are worth looking at for this.
I don't think so. Using the numbers in the link, I get 5.8% on an annualized basis from june 2021. I am pretty sure the 5.4% is the " flawed" measure comparing to same month last year.
But I also get 11.4% for month to month from may to june. So, using those more accurate numbers, inflation showed a big drop and would have been better if kevin used that.
But I think kevin had pointed out that up to last month we were still just catching up from the artificial price drop last year, but we had pretty much finished that catch up. So this just illustrates that the huge 11% last month was a catch up and should not last ( and it did not). But also that now we might be seeing the real rate of underlying inflation. Near 6% is not devastating like 11% but not good either. Maybe some of it was still lingering catch up hopefully.
Except, nowadays you have to jump through a hoop, walk on hot coals, sing a song while carrying a glass of water, and at the end you need to remember your PIN, to get your coupons added and the super-saver discount rates.
Today we are all Sir Gawain.
Kevin has convinced me. Because food prices have "only" risen 2.6%, there is nothing to worry about because that's the only thing we consume.
What a relief!
Especially for the multitude of poor people who:
Don't hold real assets
Don't hold inflation-resilient financial instruments
Don't have COLA adjustments to their pay
But do hold cash or put it into a bank account that yields a whopping 0.01% (Wells Fargo this morning).
We're about to find out what happens when Delta meets China's zero infection strategy and ports are closed from a single infection.