
Exciting news today! After eight long years the Department of Education has finally released a new edition of the long-term NAEP assessment. Note that this is not the main NAEP, which is generally considered the best reflection of student achievement. However, the main assessment has changed modestly over the years while the long-term assessment is designed to be frozen in amber, thus providing a better comparison over time even if some of the questions are more out-of-date than they should be.
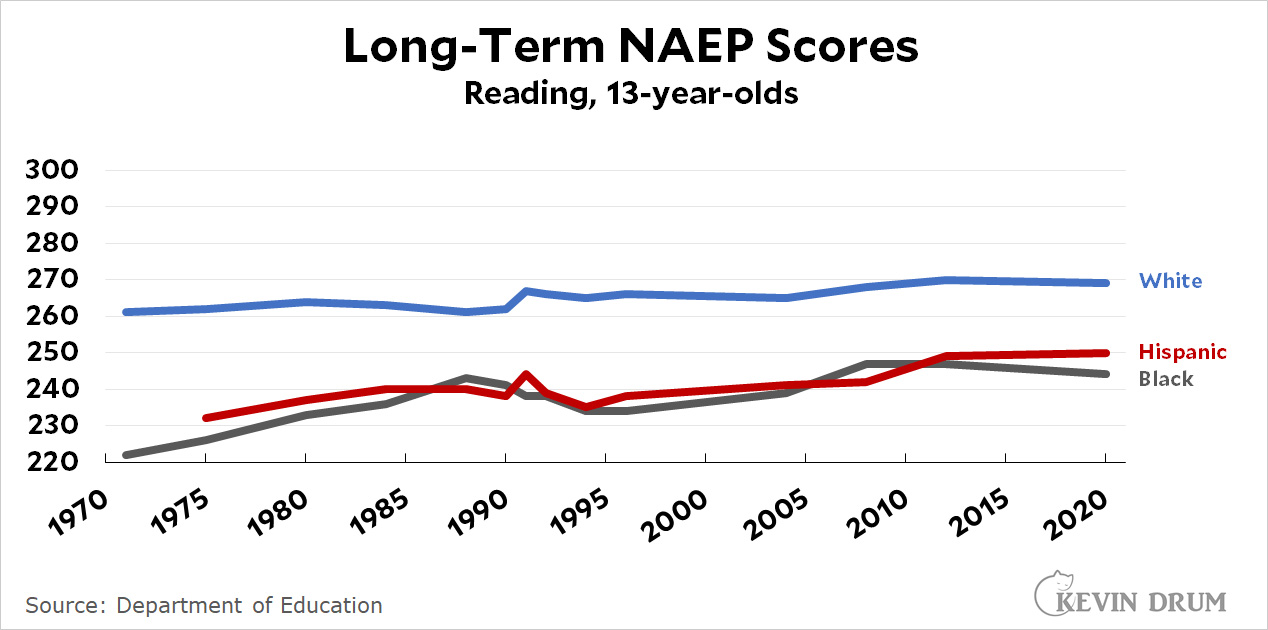
So without further ado, here are the latest reading scores for 13-year-olds:
 And the math scores:
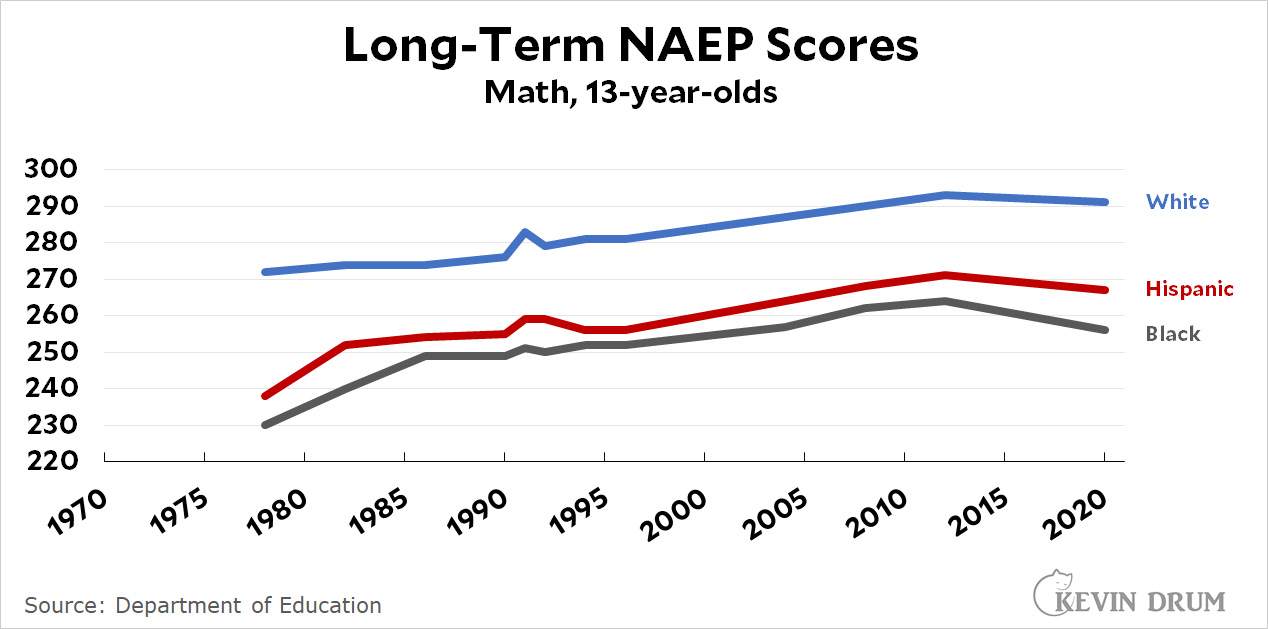 Among white and Hispanic kids, there's nothing much to see. Reading scores are basically flat and math scores are slightly down, but still far higher than they were at the start of the century.
Among Black kids, however, the story is more dire: Reading scores are down 3 points and math scores have plummeted 8 points since the last test. Black kids have basically given up all their gains in math since 2000. The Black-white gap is now as big as it's been since 2000 in reading (25 points) and since 1980 in math (35 points).
This is not the final word. The main NAEP is still the best assessment and it doesn't show that the Black-white gap has grown this much. Still, no matter how you cut it, the gap is pretty sizeable on both tests. It's a shameful shortcoming.
It isn't clear "exciting" is the best description...
Maybe they don't care about the test. Looks like a growing consensus among all demographics.
In case anyone was wondering, the assessment schedule for 2020 LTT was 13-year-olds: Oct-Dec 2019, 9-year-olds: Jan-Mar 2020, 17-year-olds: Mar-May 2020.
The assessment of 13-year-olds was completed on schedule, the assessment for 9-year-olds was suspended partway through for reasons that escape me at the moment, and the assessment for 17-year-olds was never started.
There was a lot of debate regarding what to do about the incomplete assessments, with the decision being to finish/redo the 9-year-olds in 2022 to get better coverage, and to either postpone for now or skip entirely the 17-year-olds.
This is a result of common core. I am a progressive educator, and I opposed common core because its lack of focus on fundamental skills, and obsession with synthesis, leave struggling learners behind. The gap is growing again, and it's up to the people who radically altered the curriculum to prove that's not why.
Why are Asians always left out of these graphs? If we're going to analyze by race/ethnicity and then draw conclusions from that, leaving Asians out seems dishonest, and leads readers to make assumptions that they might not if they saw that Asians have been blowing the doors off of White kids for years.
They're not left out, in general. If you look at NAEP 2019 (the most recent big NAEP year), you'll see the results broken out into more racial/ethnic groups. See, for example, California: https://nces.ed.gov/nationsreportcard/subject/publications/stt2019/pdf/2020013CA4.pdf
But you won't see it for NAEP 2020 LTT because the sample size is too small. The same is true for some states in 2019. For example, Alabama, where only White, Black, and Hispanic meet the statistical thresholds: https://nces.ed.gov/nationsreportcard/subject/publications/stt2019/pdf/2020013AL4.pdf
You know, maybe this is easy to miss, but looking at Steve.OH's link, yeah, its broken down by more ethnic groups, but you know what leapt off the page for me?
Eligible for free lunch 223.
Ineligible for free lunch 252
While White and Asian were indeed in the 250s, would anyone besides me consider the political benefit in re-framing this as a class problem as opposed to a race problem?
We have a specific problem in this country due to the facts that (a) for over 150 years Black kids were not only Black, but systemically guaranteed to be poor, and (b) as far as Hispanics are concerned, we have a steady inflo of under-educated immigrants who start out their time in this country poor, moreso, by far, than say Asians.
Most of the Trumpers are too far gone anyway, but consider how many poor whites are out there who could be nudged back in the direction of sanity if they could be persuaded to note that the Dems are not just about giveaways to minorities.
It's generally been shown that the strongest predictor of just about anything that we would consider to be "successful," whether academic success or good health or just about anything, is family socioeconomic status while growing up.
I guess I was referring to Kevin's graphs, specifically. The NCES website lets you easily generate long term trend graphs that include Asians, but Kevin never includes them.
It just seems like an uncharacteristic "not adjusting for inflation" type graphing trick on Kevin's part, I have to assume to bolster the notion that it's "a shameful shortcoming" on (glares at the white people) somebody's part.
For the record, the reason I bring it up is that I really do think understanding why Asian kids are doing so well is the key to gaining real traction on this issue, because it removes institutional racism as the obvious culprit. Combating institutional racism is a worthwhile goal, but we've been at that for decades while disparities have barely budged. This is generally seen as a rationale to double down on combating institutional racism.
Thinking about why White kids are lagging behind Asians frees us to consider other dynamics affecting performance.
Asians are not a monolith.
I haven't tried tracking H1B immigration by race and how that affected the population in the US. It does look like immigrants coming in for high paying jobs can make a given group look really good.
https://www.americanprogress.org/issues/immigration/news/2015/05/21/113690/asian-immigrants-in-the-unites-states-today/
The issue is social conservatism, of course.
You're not going to be a good student if you're brought up to be a bad student, just because you're in school.
Nope. The issue is whether the family cares
On a related tangent? https://abcnews.go.com/US/nfl-players-reach-agreement-end-race-norming-concussion/story?id=79872743