Skip to content

Nick Kristof wrote yesterday about the huge rise in single-parent households over the past 60 years, especially among Black families. This has been a subject of public discussion ever since the famous Moynihan Report was issued in 1965, which detailed the "pathology" of Black family life in the wake of hundreds of years of brutal treatment. Here's the basic data:

Moynihan was concerned about the rise of single-parent households at a time when "illegitimate" births (the usual name back then) had risen only from 18% to 25% among Black families. The real explosion was in the years after that. Between 1965 and 1990 the number rose to 70%.

But why? Kristof offers up the following:

I think the big driver for the rise in single-parent households is bad decisions by policymakers that led to mass incarceration and a collapse of earnings for working-class men.

There's no question that incarceration skyrocketed during the 1965-90 period, though it didn't get underway until the mid-70s. But was there a collapse in earnings for working-class men? Here's the data:

None of these is a perfect indicator, but taken together they suggest that working-class men, and Black men in particular, never suffered a collapse in employment or a collapse in earnings. Black men had higher unemployment and lower wages compared to white men, but the gap was steady over time.

Whatever happened, the timing doesn't fit mass incarceration as an answer, and there was never a big change in employment or earnings. Something else has been at work.

As expected, the DOJ special counsel indicted Hunter Biden today on charges of lying about his drug use when he purchased a handgun in 2018:

Republicans have been complaining forever that the Hunter Biden investigation is politically biased. They're right. Hunter is being treated unusually harshly because the special counsel is afraid of Republican backlash. In a world with no fear of Republican retribution Hunter would, at most, be ordered into the diversion program that he was offered before the plea deal fell apart.

The redoubtable Wall Street Journal opinion page says that Bidenomics is a crock. The Census Bureau just released its estimate of annual income for 2022, and after adjusting for inflation it's fallen from the previous year:

The Census Exposes Bidenomics
Its annual report shows how inflation has gutted real household incomes.

....Middle-class Americans who think they’re losing ground are right. The reason is that inflation has outpaced the earnings growth from work.

As usual, they're distorting the story. The main reason real wages have fallen is that they spiked upward in 2020 thanks mostly to statistical artifacts. As those artifacts faded away, the official numbers reverted to their old values.

That said, here are all the different measures of income that I could round up. All of them are measured from the final quarter of 2019 to the most recent quarter of 2023 using the usual CPI index. The exceptions are the Census Bureau numbers, which are annual and use the C-CPI chained index.

The Journal, naturally, is focusing on the worst number because it fits the point they wish to make. The reality is that, adjusted for inflation, almost every measure shows that average incomes are about flat.

That's nothing to write home about, but it's a far cry from the middle class being gutted during the Biden era.

POSTSCRIPT: It's worth noting that the CPI inflation index diverged considerably from the PCE index during the pandemic. Here's the same chart as above, but using the PCE inflation numbers consistently for everything:

The PCE index treats housing differently than CPI and was likely more accurate during the housing boom of 2021-22. However, I normally use CPI and I don't like to cherry pick based on what's convenient. That's why the main chart uses CPI.

This is the Los Angeles skyline at dusk seen from Angeles Crest Highway. About a third of the way from the right-hand border you can see downtown with Catalina Island behind it.

April 8, 2023 — Angeles National Forest, California

While I was puttering around in the GSS data for my previous post, I happened to take a look at self-reported political ideology. In particular, I looked at how many Republicans described themselves as conservative and how many Democrats described themselves as liberal. Here it is:

Republicans have been growing steadily more conservative for 50 years. During this time, the share saying they are conservative has grown by 29 points, from 44% to 73%.

Democrats, by contrast, had a long stretch of time from 1990-2015 when nothing much changed. But starting in 2016 their liberalism shot up. Over the entire 50 year period, the share saying they are liberal has grown by 27 points, from 34% to 61%.

Put another way: since 2016 Democrats have moved substantially leftward while Republicans have barely moved at all.

Put in yet another way: over the entire 50-year period, both parties have moved equally in opposite directions. But Republicans did it first.

According to the General Social Survey, here's the trend in people reporting that they aren't very happy:

I struggle to reconcile this with reports that young people are depressed, stressed out, and generally kind of miserable. From 1970 through 2018, there was very little change in young adults reporting that they aren't happy. It bounces around in the range of 10-15% the entire time. And even if you assume that the effect of the pandemic is permanent (which is unlikely), this has increased by only 5% since then.

This doesn't mean that reports of mental distress among young adults are wrong. It just means there's a disconnect of some kind. In the GSS survey, their level of unhappiness is about the same as everyone else and it hasn't changed much over 50 years aside from the COVID years. I would very much like for someone to figure out what's going on here.

From Kevin McCarthy at a closed-door meeting of the Republican caucus, daring hard-right loonies to oust him:

You guys think I’m scared of a motion to vacate. Go f---ing ahead and do it. I’m not scared.

You tell 'em, Kevin.

The Wall Street Journal says oil prices are "soaring":

Hmmm. Here is the spot price of West Texas Intermediate since the beginning of the year:

It's up about 10%, from $77 to $87. The Journal got its much larger number by (a) using the NYMEX future price, and (b) cherry picking the start of the chart at the very lowest point of the year. Does this help readers understand what's really going on? Or does it help to see a little bit more?

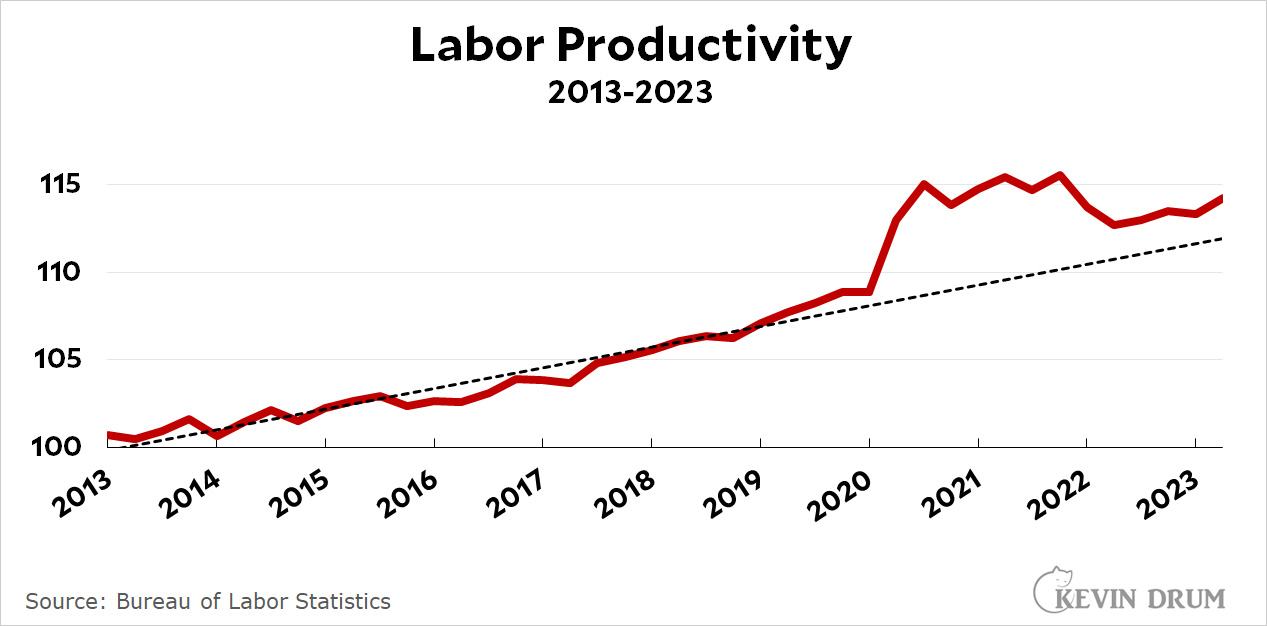
It appears to be a thing lately for CEOs to blurt out their frustration over the fact that their workers want raises. "Nobody wants to work anymore" is the usual refrain. Or, since unemployment is demonstrably low, perhaps they admit that people are working, they just aren't working very hard. But it ain't true:

Productivity is mostly the result of improved equipment, but it would nonetheless go down if there was some kind of mass shirking in the workplace. Obviously there isn't. Labor productivity right now is above its pre-pandemic trend. So maybe we all cut the crap about lazy workers who got a little too full of themselves during the pandemic?

The August spike in inflation was obviously bad news, but there's a bit of positive news in today's figures too:

Inflation in goods has been below 2% for the entire past year, and last month's spike was the result of a transitory rise in gasoline prices. Nothing much to worry about. But inflation in services remained stubbornly high until it fell below 4% in May. In August there was no spike in services inflation.

Inflation in services has been our key problem ever since supply chain pressure eased up last year. It's good news that nothing much happened to it in August.