The headline rate of inflation clocked in at 5% in May according to the BLS. However, using my handy inflation calculator, which adjusts for the low baseline in May of last year, the real-world inflation rate was actually 3.5%.
Note that by "real world" I mean only that 3.5% probably does a better job of representing what's really going on with the economy. Inflation is a little higher than normal, which is unsurprising given the large amount of stimulus spending and the eagerness of consumers to start buying again after a year of pandemic. However, inflationary expectations are still pretty well anchored at just over 2%, so it appears that investors aren't too worried about a long-term inflationary spiral.
Medicaid is the federal government's single biggest social welfare program aimed at helping the poor. It has grown steadily since its founding, aside from a brief growth spurt after Obamacare was passed, and currently serves about 70 million people representing more than 20% of the total US population:
The cost of Medicaid grew rapidly through the '80s and '90s thanks to the high growth rate of medical costs in general. However, its cost has mostly flattened out over the past couple of decades:
Medicaid is financed jointly by the federal government and by state governments. Last year, total spending on Medicaid amounted to $650 billion, of which one-third was paid by the states and two-thirds by the federal government.
Data through 2017 comes from the 2018 CMS actuarial report here. Data from 2018-2020 was extrapolated from growth rates reported by the Kaiser Family Foundation here.
What is this? The first person to correctly identify it gets the warm thrill of being right.
UPDATE: And the winner is D_Ohrk_E1, who correctly recognized this as a parking structure across the street from the UCI Medical Center in Orange. One side is covered in mostly bluish flaps and another in mostly reddish flaps.
The history wars, they are a comin'. Actually, they're here, as red states across the nation take a stand against teaching our kids about Critical Race Theory. Never mind that most of what they object to has nothing to do with CRT, which is just a handy label for scaring the rubes. The important point is that there really are things they object to and they're mad as hell about it.
It's worth noting that (a) this is nothing new, and (b) both sides take it seriously because they know that what we teach our kids will eventually become what they believe as adults. It's well to remember that 2,500 years ago Socrates was executed less for his heterodox beliefs than for the fact that he insisted on teaching them to the impressionable youth of Athens. More recently, these kinds of fights have been common in the postwar era, centering on evolution, reading, math, history, civics, and just about every other subject imaginable.
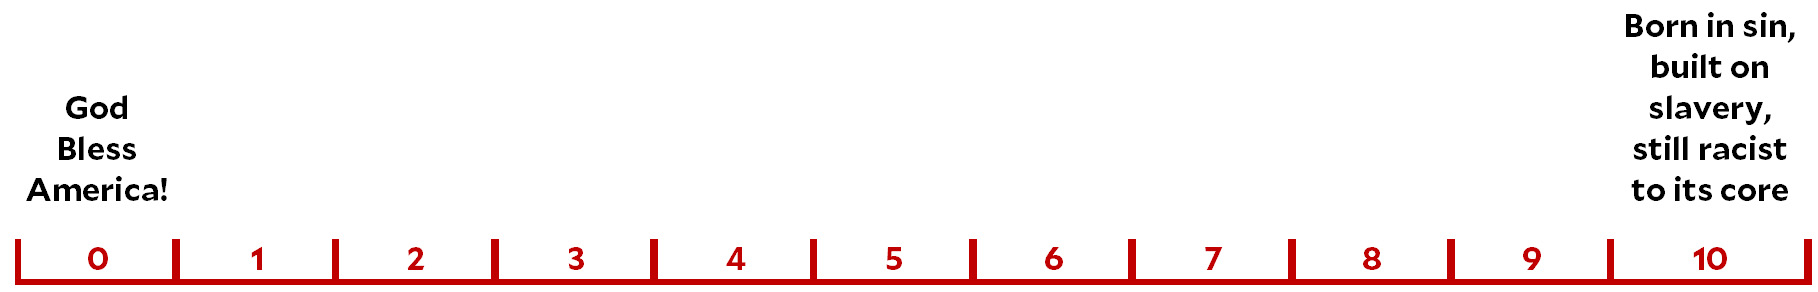
But I have a . . . test? Yes, a test for you. It's easy to vaguely take one side or another in the latest history war, which primarily relates to how much American children should be taught about slavery and racism in both the past and the present. So let's quantify this with a scale from 0 to 10. The extreme ends look something like this:
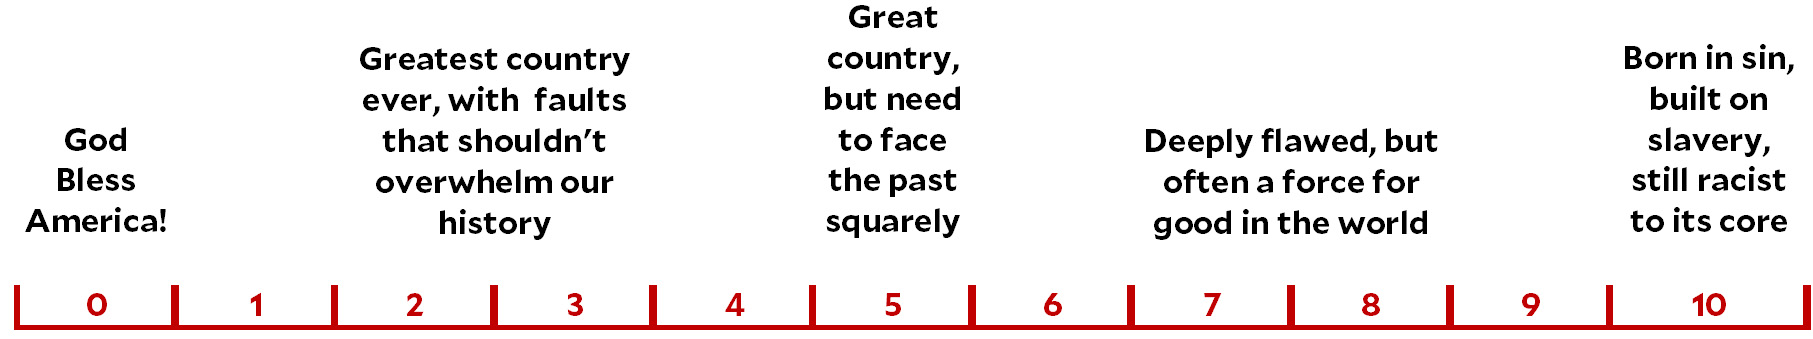
I imagine that few of you are on either of these extremes. But where are you? Let's expand our scale a bit:
A numerical score may seem almost pedantic at first, but it forces you to take a real stand. Just how much should our ugly past dominate the teaching of history? And how does this change at different grade levels? No one thinks we should teach third graders the full, gruesome facts about slavery and native genocide. At the same time, nobody (I hope) thinks we should withhold this kind of thing at the university level.
So go ahead. Pick a score for elementary school, high school, and college. Just how much should our history curriculum emphasize slavery in the past and systemic racism in the present?
Payrolls have risen 1.6 million in the past three months and are up 1.7% this year through May, which in normal times would be impressive. But these aren’t normal times. The economy is rapidly reopening, consumers are flush with federal stimulus cash, and retail sales, factory orders and housing are all booming. Inflation-adjusted gross domestic product is up 5.3% through May this year, according to a monthly series calculated by IHS Markit.
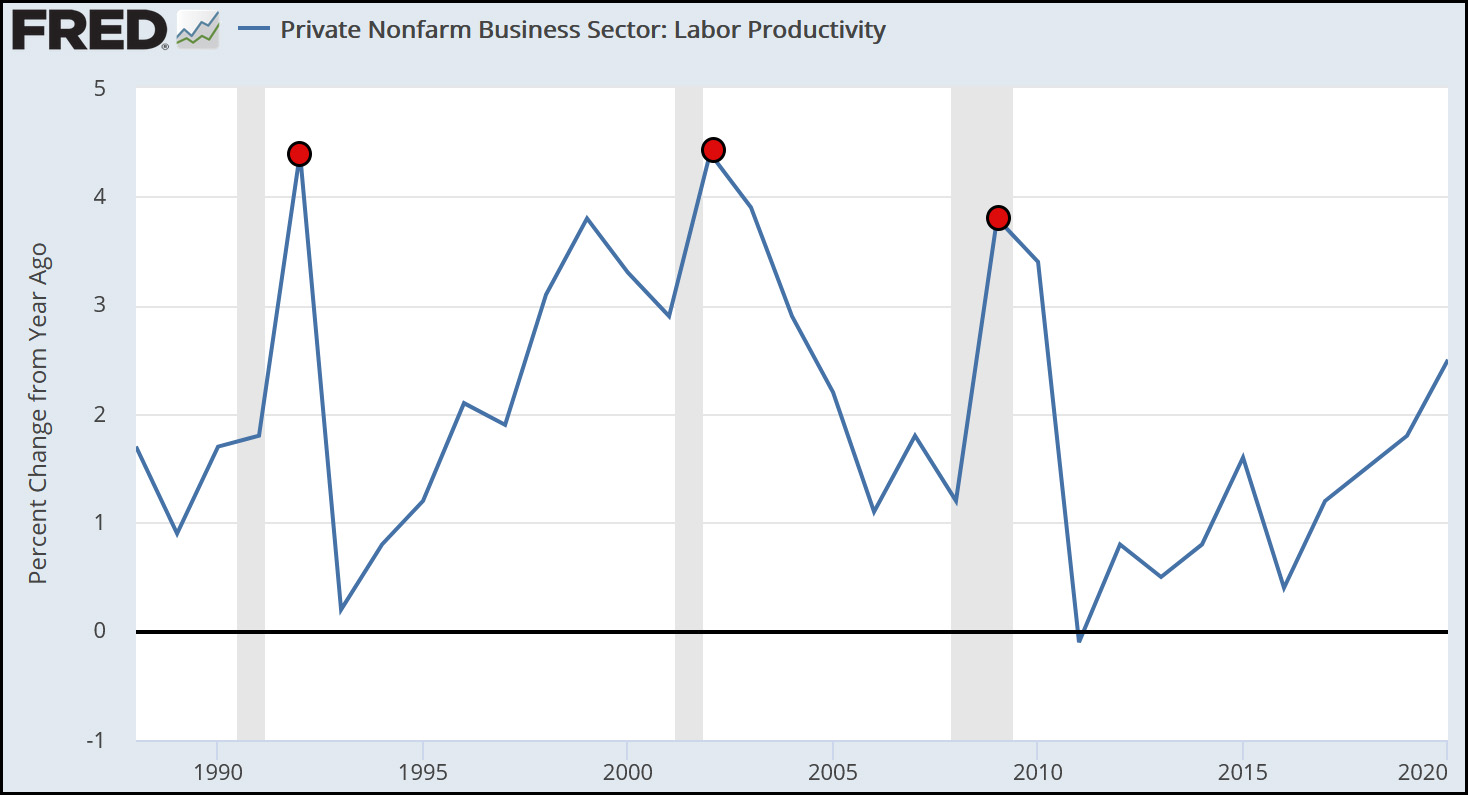
The gap between GDP and jobs is explained by soaring output per worker. The U.S. is in the midst of a productivity boom.
In other words, many businesses are making do with fewer employees by adopting labor-saving technology. But it's worth noting that this is pretty common toward the end of recessions:
During recessions, many employers start looking at technological improvements that didn't seem worth considering when business was booming. Then, when the recession ends, they just keep on using it if it turned out to work well. I don't know for sure if we'll see the same dynamic this time around, since many employers explicitly viewed the recession as limited in time, but I wouldn't be surprised.
Tomorrow the BLS will announce the headline inflation rate for May and there will be much gnashing of teeth and hot takes everywhere. I've already warned you that the official number will be unrealistic because it's based on a comparison to last May, which was artificially low. But what is realistic? Behold my handy inflation calculator:
As an estimate of the real-world inflation rate, I've eliminated the dip in 2020 and replaced it with a straight line. Using this, the CPI index in May 2020 was 259.391.
So when the BLS announces its growth number, ignore it for a moment and instead take a look at the raw index. Then divide it by 259.391 to get a more realistic growth rate.
Please note that this is not an attempt to "deskew" the inflation number or to provide a "true" inflation number. The BLS number will be correct. However, it will also be misleading if you want to know the true state of the economy. My version is less misleading, even though it's technically wrong.
But fear not, inflation hawks! Even using my calculator, the inflation rate for May is likely to be fairly high. It will be at least 3% and probably a bit higher. That's plenty high enough to run around demanding that we throttle the economy now now now in time to affect the 2022 election rein in spiraling inflation.
Joe Biden's infrastructure bill can be passed by reconciliation, which means it only needs 50 votes (plus Kamala Harris) to pass in the Senate. It currently has 49, so all Biden needs to do is win Joe Manchin's vote by showing that he's done his honest best to bring Republicans on board but they refuse to cooperate.
The voting rights bill cannot be passed by reconciliation, so it needs 60 votes in the Senate. This is never going to happen. The only way to pass this bill is to kill the filibuster, which is opposed not just by Manchin, but probably by several other Democrats who are keeping a low profile.
Roughly speaking, what this means is that an infrastructure bill of some kind remains a possibility. A voting rights bill has never been a serious possibility and still isn't.
Federal housing assistance has long been a troubled program. For the past few decades it has helped a steady 5 million households per year even as the US population has grown. This naturally represents a dwindling percentage of all households:
The decline in the share of households receiving assistance is not due to lack of need. It's due to lack of funding. Section 8 vouchers, in particular, are enormously backlogged and have a waiting time of years to get on board.
The amount of assistance has risen since 1980, but since 1995 has flattened out at about $10,000 per household:
Republicans have been effective at blocking higher levels of housing assistance, probably because there's also a strong constituency of landlords who dislike it. This is obviously unfortunate since the cost of housing has increased significantly over the past 20 years and has become an ever larger burden for low-income households.