
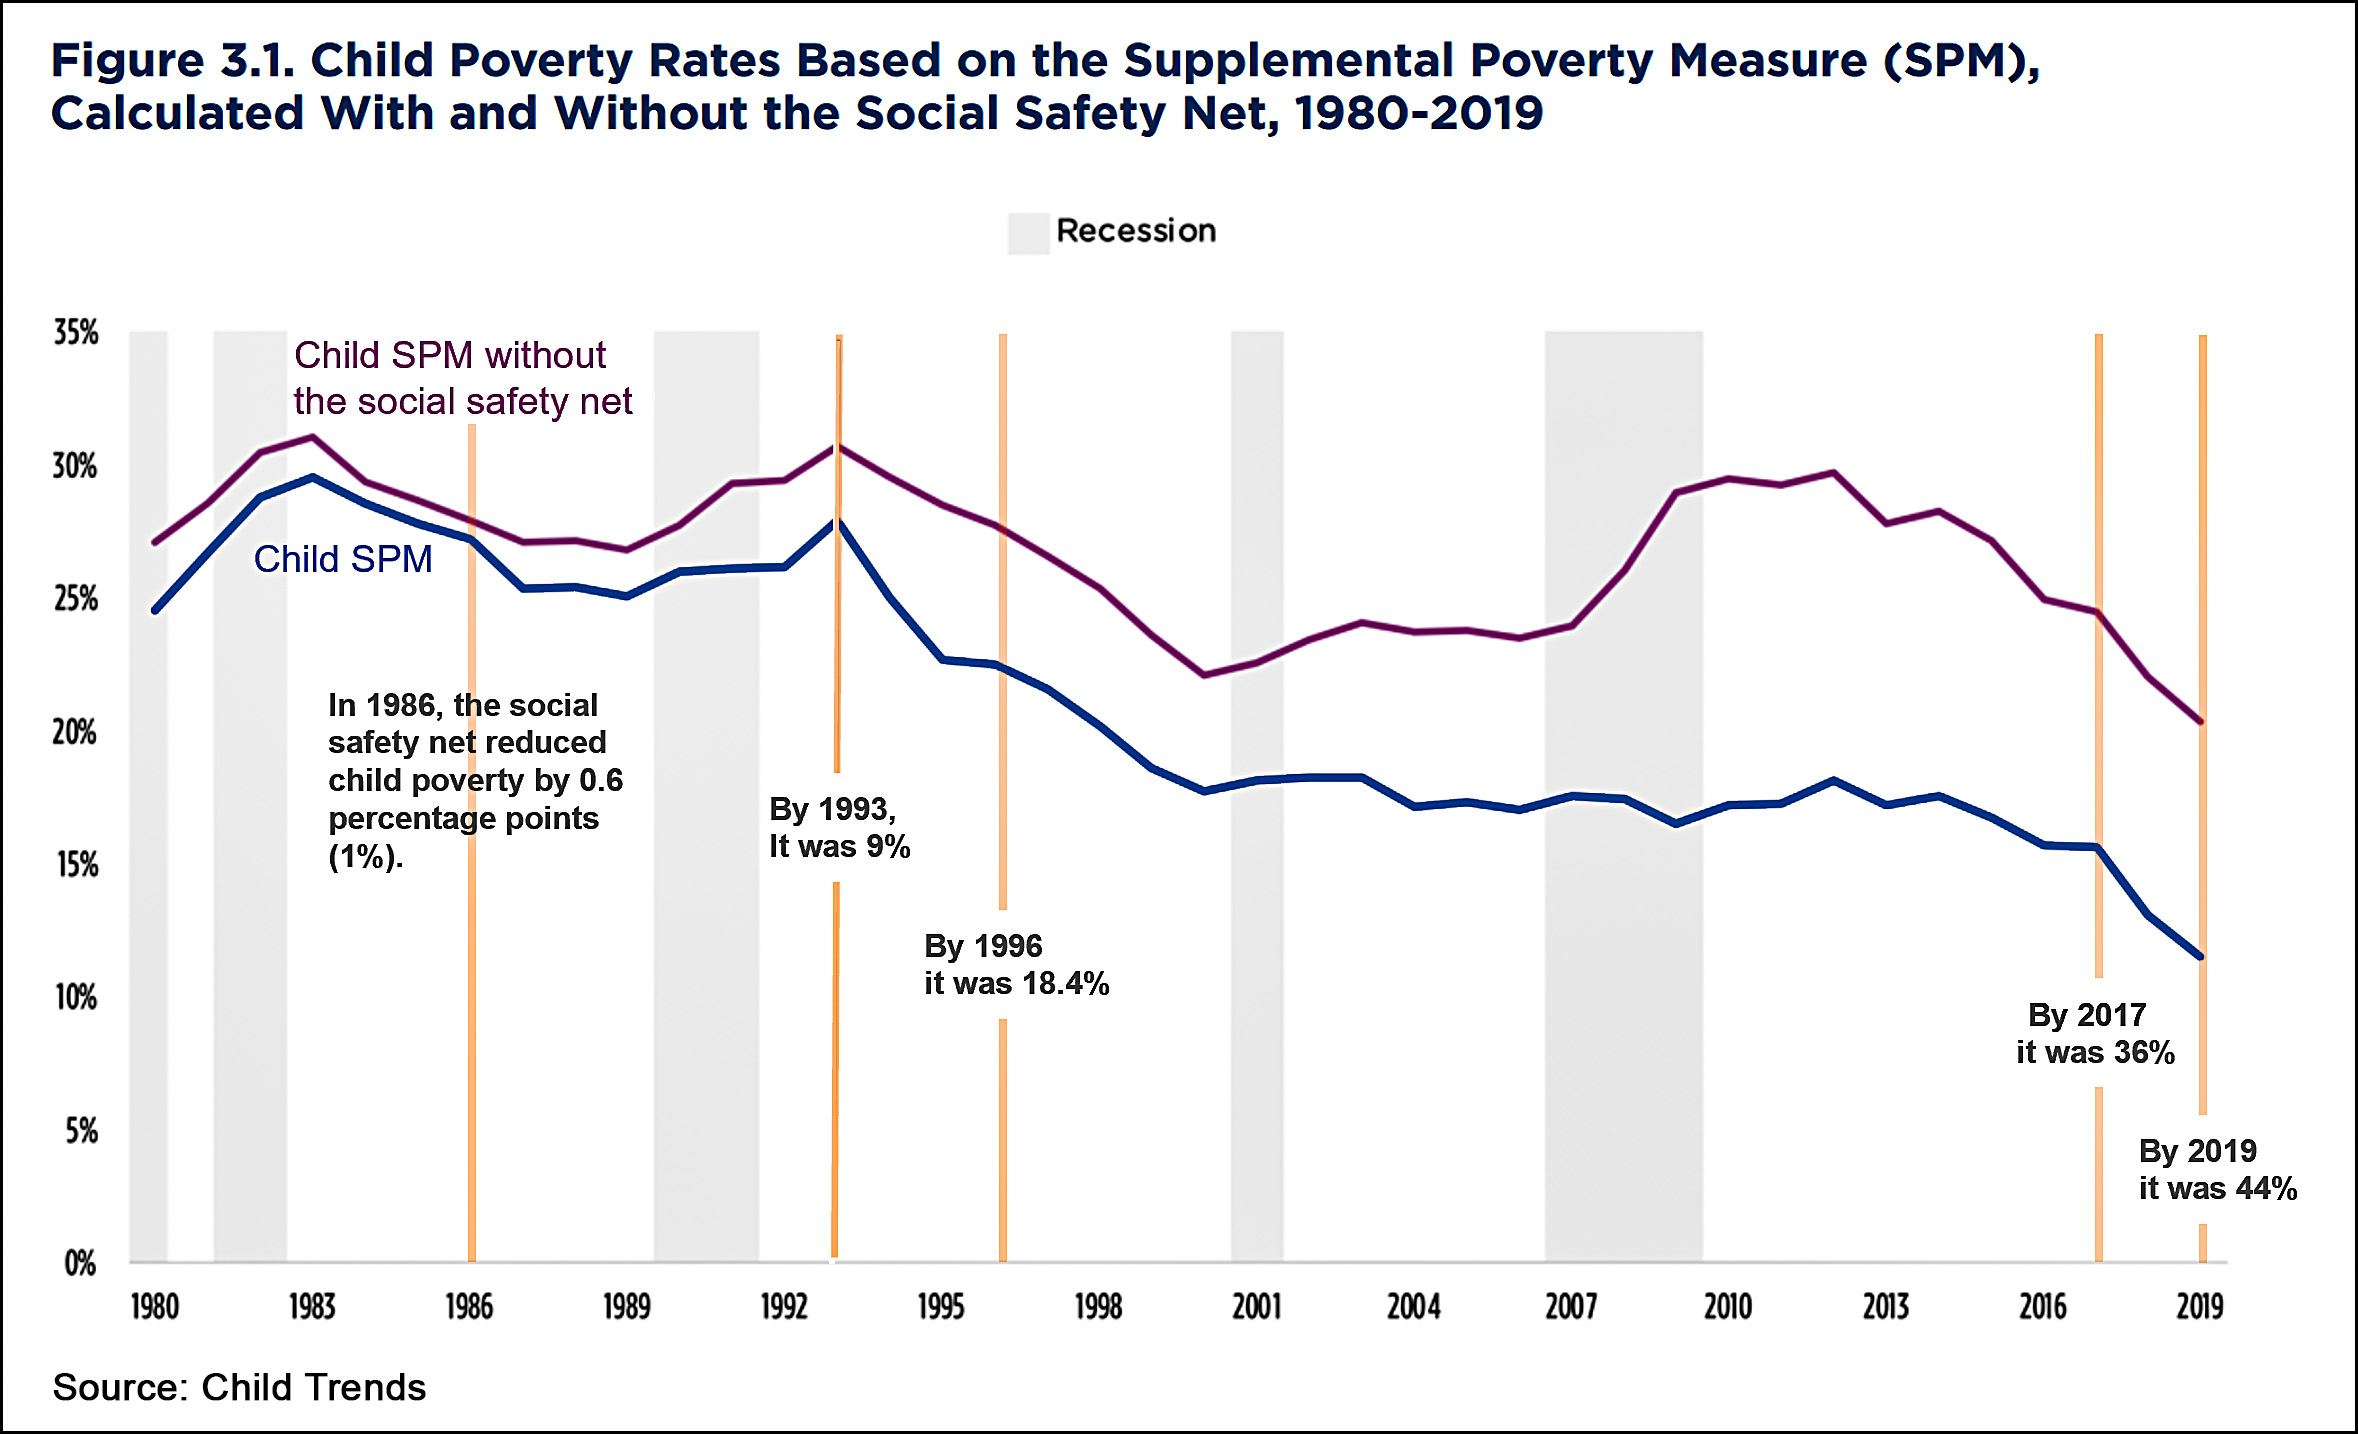
Via the New York Times, here's a chart from Child Trends that shows how much the social safety net has reduced child poverty over the past 35 years:
 Before 1986 the social safety net was almost nonexistent for children. Altogether, it reduced child poverty by only 1%.
- In 1986, Ronald Reagan's Tax Reform Act increased the Earned Income Tax Credit, and by 1993 the safety net was responsible for a reduction in child poverty of 9%.
- In 1993, Bill Clinton increased the EITC again, and by 1996 the safety net was responsible for a reduction in child poverty of 18%.
- In 1996 Clinton passed welfare reform and by 2017 the safety net was responsible for a reduction in child poverty of 36%.
- In 2017 Donald Trump passed the 2017 Tax Act, which included an expansion of the Child Tax Credit. By 2019 the safety net was responsible for a reduction in child poverty of 44%.
There were other things along the way, some permanent, some not. But the bottom line is simple: today about 11% of children live in poverty. Without the social safety net erected over the past 35 years, that number would be 21%. That's 7.6 million children who no longer live in poverty thanks to federal and state safety net programs.
POSTSCRIPT: The "poverty line" is strictly a cash measure, so it's worth pointing out that tens of millions of children have also been helped by Bill Clinton's Children's Health Insurance Program (CHIP). Free health care doesn't get counted in the poverty calculations, though.
If we don't punish children for making a bad choice of parent(s), America loses.
Yeah! Why don't these tots just pull themselves up by their diaper straps?
Oranqe Qounty GQPer Kevin Drum treading dangerously close on Elizabeth Bruenig's territory of crediting Donald Trump for the child tax credit.
It's interesting that the value of healthcare transfers isn't included in poverty calculations. I wasn't aware of that. Doesn't seem as if it would be that hard to do. For CHIP, you could calculate the healthcare consumed by (say) 1-year olds (do another one for 2-year olds, and 3-year olds, etc) and divide that number by the total number of children in the cohort to get some idea of what the financial cost of coverage would be. It's not going to be a huge number for young children, given their health status relative to older people, but it's far from nothing. For 80 year old Americans, the corresponding number (Medicare) must be huge.
Anyway, such calculations would probably be crude, so perhaps that's why they're not done.
You can’t eat health insurance. Nor use it to house and clothe your kids. So one really good reason for excluding it from household income calculations is - unless your kid has a super serious disease that requires long term hospitalization - having health insurance doesn’t help your household meet its daily living costs.
having health insurance doesn’t help your household meet its daily living costs.
Maybe, but I think that's a very questionable statement. Would you like to go without coverage?
If the government provides a service that the market would charge, say, $700/month for, they're saving you a lot of money! (Or, alternately, they're making a payment-in-kind to you).
Here’s a scenario that makes what I’m saying crystal clear:
Poor household 1 gets $1000 in CHIP coverage every month and nothing else.
Poor household 2 gets $1000 in food stamps and rental assistance every month and nothing else.
PH2 is almost definitely better off in real day-to-day material terms that PH1. The only way PH1 is better off day-to-day is if they have a really sick kid who actually uses $1000 or more in medical services every month. Otherwise, the real life value of the CHIP coverage if you have generally healthy kids is way less than $1000 and you would’ve been better off (probably) in getting assistance with food and housing costs instead.
I don't know which poverty level is used in this calculation, but the official one used to determine supplements for the ACA and a number of other things is a simple once-fixed number which is incremented by the CPI. Since the overall national production - GDP - increases faster than the CPI (or in other words there is on average real growth of GDP), a person at the poverty level is getting an ever-decreasing per-capita share of that production. Other poverty levels may be based on a fraction of median income, which has increased a little faster than the CPI since 1973 but still less than GDP. As far as I know, poverty levels are themselves measures which fall behind the growth of the economy.
So the fact that a smaller number of people fall below the poverty level does not necessarily mean that inequality is decreasing.
Indeed, policies that promote inequalities increase the need for safety nets
The poverty indicator used in the Times article takes into account government transfers, which the ACA exchange income does not include.
Where does free school lunch (and breakfast) fit?
Even though Republican presidents signed some of this stuff, the GOP as a whole has fought child poverty programs tooth and nail for most of its existence up to today. Any time anything beneficial to (non-rich) kids and families makes it through a budget bill, you have Democrats driving a hard bargain to thank for it.
That's a pretty petty comment considering the post had nothing to do with dems versus republicans. It's like you're just looking for any opportunity to criticize your fellow Americans (who happen to be members of a different political party) and further sow discord.
So pointing out the awfulness of the Republican party on child welfare policy is being petty? Maybe Republicans should do better, then. I call it providing much-needed context.
I was a bit surprised to see Trump credited for reducing child poverty. According to the Center on Budget Policies and Priorities, the 2017 tax cut increased the child tax credit, but the increase was quite small near the bottom of the income scale:
Single mother, two children, earning minimum wage ($14,500/year): $75
Married couple, two children, earning $24,000/year: $800
Married couple, two children, earning $100,000/year: $2000
Married couple, two children, earning $400,000/year: $4000
Additionally, the 2017 bill eliminated the child tax credit for roughly 1 million low income children whose parents are not here legally.
Child Trends found that the Federal program that does the most to reduce child poverty is the earned income tax credit. The 2017 bill didn't change the size of this credit, but indexed it to the chained CPI. Under previous law, the EITC was indexed to the traditional CPI (not chained). This change to the indexing means that the EITC is expected to gradually shrink over time relative to what it would be if the 2017 bill had not been passed.
So it seems that the 2017 law reduced childhood poverty, but I suspect that the objective was to provide a bit of political cover for the bill. If cutting childhood poverty were the primary goal, the bill would have given more than $75/year to the single mother earning minimum wage, and wouldn't be sending money to couples making $400,000 per year.