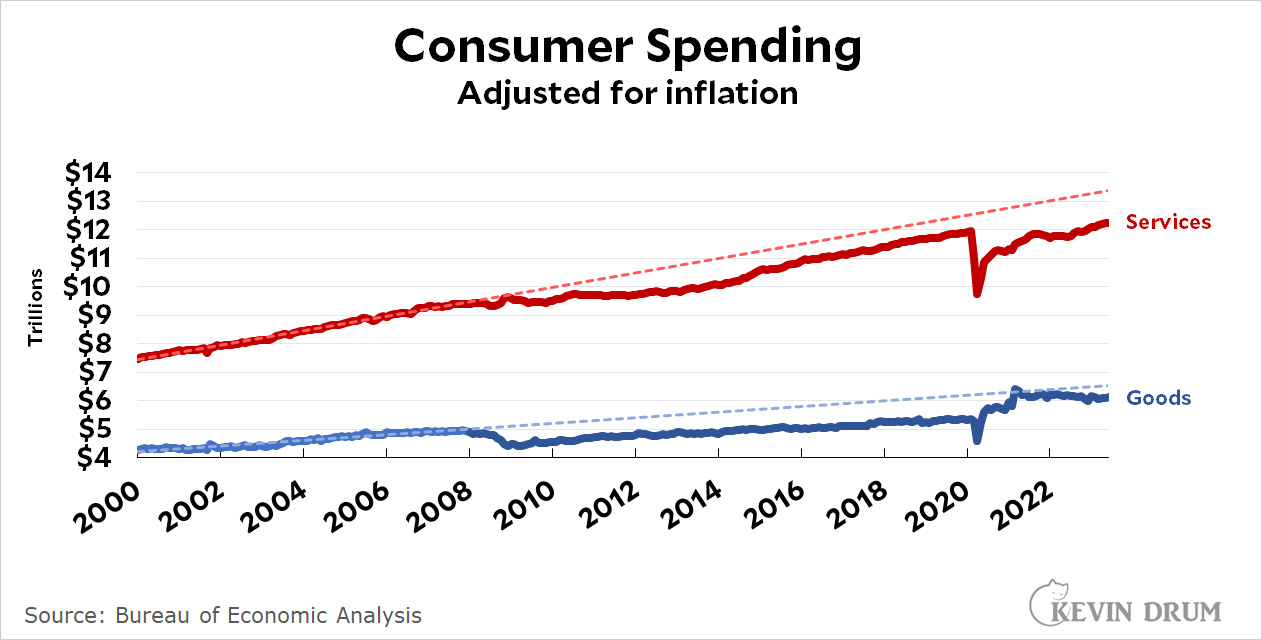
We have still not caught up to the trend from before the Great Recession. We probably never will:
Cats, charts, and politics

We have still not caught up to the trend from before the Great Recession. We probably never will:
Comments are closed.
This is an unspeakable tragedy. All that stuff. All that stuff that will never [choke] never have been bought. The loss is everybody's; it's the world's. We are all diminished.
Why won't Biden declare a day of mourning? Why does he hate the American consumer so much?
My thoughts exactly. Consumerism is the main cause of greenhouse gas emissions. The principal villain is not the fossil fuel industry, it's the advertising/marketing industry. Next in line is the fashion industry. Buying all kinds of crap that consumes gobs of energy and then ends up in landfills is why we have climate change.
Like +10! If not for non-stop, ubiquitous advertising, would we even know that we "had to have it"?
You seem confused. The charts show purchases of junk is strong, services lagging.
Hot take: consumer spending should be adjusted for wages, not inflation.
Lost decades/ generation
Real on the web home based work to make more than $14k. Last month I made $15738 from this home job. Very simple and easy to do and procuring from this are just awesome.
For more detail visit the given interface.. http://incomebyus.blogspot.com
That red line show a zero root!!
The blue one may be going there.
Probably a good thing? I think so.
One obvious answer here is that tech and transportation have gotten cheaper and last longer. I have a ten-year-old laptop. Back in the early 2000s I "upgraded" almost every year. My phone is 6 years old. Still fine. I drive an older car with good gas mileage and low miles. I'll switch to electric but I work from home so I hardly drive anywhere. There are just fewer reasons to buy shit.
I haven’t had a phone battery make it past three years. The charge ports get flaky, too.
Can you still install the upgrades on your ten yo laptop?
(Now, if you run one of the open source systems, you're probably ok).
Well good. Now start a new trendline
Macroeconomic parameters such as GDP follow a saw-tooth pattern. Typically there is a fairly long upward trend in expansion, followed by a shorter and steeper down trend in recession. Kevin has drawn his long-term trend through an expansion period 2000-2008 (although the GDP expansion didn't start until near the end of 2001). This is a no-no - in the real world expansion trends are not sustainable forever.
A valid long-term trend would have to be drawn through several up-down cycles, going back several more decades. Of course there tend to be changes in overall trend on such scales anyway - the trend wouldn't necessarily be a line. Also the expansion after 2009 was long but historically sluggish -not as steep as previous recoveries.
Why do you suppose we never will?
Given the demographic changes over the last 20 years its not clear that we should be on the randomly selected trendline.
Plus, the inflation adjustments over the last few years are doing most of the work in making it appear to be well below the trend. Its not clear that these statistical adjustments are adding clarity or opacity to the figures.
But, even with all that said, the charts do appear to argue against the need for rate increases. The made up narrative that out of control demand and spending were causing inflation was never supported by any data, but this chart does a nice job of showing that.
The basis of "probably" has been given zero support in this post, may as well read your daily horoscope.
So consumer spending is down. What do you want, people to get deeper into debt?! Also, as every CEO knows, only wage increases are "inflatiohary." Price hikes? It's all good (man).