It's good to stay up to date. You might be surprised by what's changed while you weren't looking. For example:
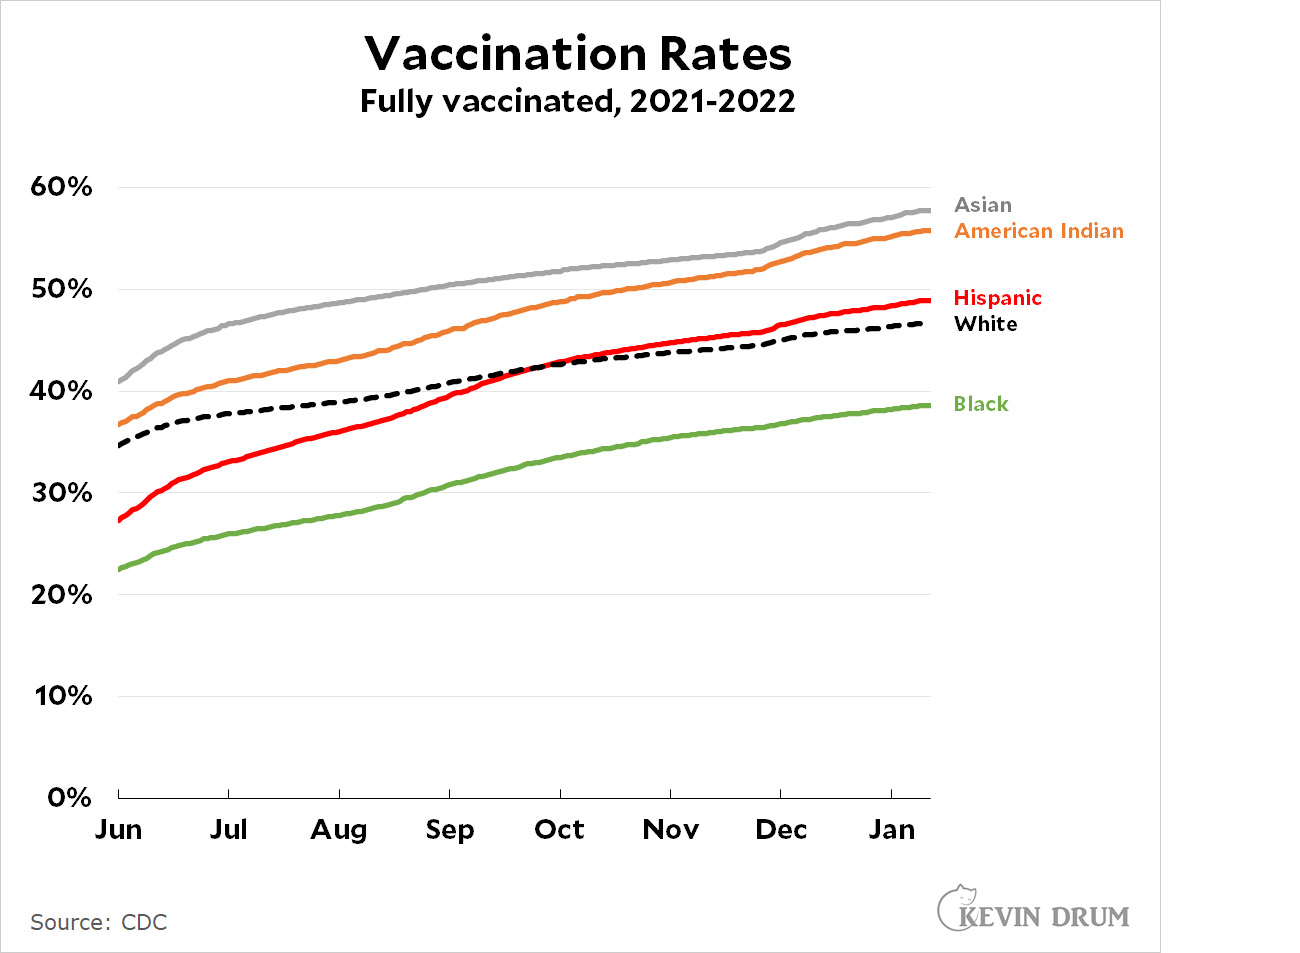 Are you surprised that the native American and Hispanic communities are now vaccinated at higher rates than white people? Probably. Even many Hispanic writers seem unaware that their community surpassed whites several months ago. Conversely, the Black-white gap is still large, although over the past six months it's narrowed from 12 percentage points to 8.
Here's another interesting thing. In addition to administrative data about who's been vaccinated, the CDC also performs surveys. Here's the response when they ask people if they've been vaccinated:
 Aside from the American Indian community, everybody claims a much higher vaccination rate than the CDC records. According to survey data, Hispanic folks are vaccinated at a considerably higher rate than white people, and the Black-white gap virtually disappears.
So which is right? The official answer is the administrative data. But we know that the CDC's administrative data is fairly poor, so maybe the survey data is closer to the truth. If that's the case, then every group except American Indians is actually doing pretty well.
Is it saying Native Americans are the only ones telling the truth?
It's more likely that it's a different pool of people, honestly.
The percent of people who have gotten there first dose in the past 2 weeks (?) is much higher among the Black community than the White community.
That said, the previous iteration of the CDC page said something like 20-30% of the injections did not have demographic data. I don't see that mentioned now unless it was lumped under "mixed/other". I'm guessing death rates have more complete data.
Nope.
Nope what?
White supremacist spammer says what?
+10!
Careful! He'll accuse you of misunderstanding the dialectic or some other such tedious nonsense.
Please do not feed the troll.
Your fully vaccinated graph isn't raw vaccinated. Let's realize it's shortcomings.
I wonder how many people in the survey are responding "yes" because they are either "vaccinated" but in an Aaron Rodgers sort of way of "alternative methods" or because they have had Covid and believe that counts?
More likely that those able to be reached in the survey is a different sample of people.
I think the presentation of the administrative data is bad and mislead Kevin. Above CDC's graph, it says the total number of fully vaccinated people is 209.3 MM-- 161.6 MM wiith known ethnicity, and an additional 47.7 MM of unknown ethnicity. The current US population is about 330 MM so that is about 63% fully vaccinated, including children not yet eligible.
It appears that what CDC have done is take the 161.6 MM of KNOWN ethnicity, and divided those by the TOTAL population of each ethnicity, to construct a percentage. That's Kevin's first graph. But since almost a quarter of recipients are of unknown ethnicity, it's a hugely biased number.
That said, administrative data still says 63% fully vaxxed, vs closer to 75-77% on the survey data. So there's still a gap, but it's far smaller than it appears here at first.
I think you're right on what theyre doing with those ethnic group percentages. They are known underestimates.
Given the wide variation in vaccines by age group, I suspect that the first graph would look very different if broken down by age range. The age variable may be hiding just how large the race variable is.
Our largest nearby Native American group was hit extremely hard by the pandemic. The government enacted strict requirements, including curfews and closures. Lots of death and illness anyway.
At my first trip to the local mall in years last weekend, the percentage of masked Native Americans was markedly higher than the percentage of Anglos. I sensed a projection of pride from the unmasked as they put one over on the authorities, defying masking signs and orders. They are surely doing their part in maxing out the patient levels in the hospital.
The good news? The unmasked folks make it much easier for my kids to be in the above average intelligence range. It seems to be a mini IQ test.
From Kevin: "Aside from the American Indian community, everybody claims a much higher vaccination rate than the CDC records."
Well, consider the terminology of testing. In testing, there are false negatives and false positives to be contended with. Likewise, in questionnaire analysis, we need to recognize the same problem. There are Positive and Negative responses. Among the negative responses (i.e., "NO I am not vaccinated") what percentage of them do you suppose are false negatives? Perhaps .01 percent, maybe less. For practical purposes, you can assume the Negative responses are all true. Now, what about the positive responses? What percentage of false positives do you suspect? It's certainly a significant percentage, for the simple reason that there are some percentage of the unvaccinated who will choose not to admit it.
So when you're displaying a graph of positive response rate, you should hope to be able to adjust for the false positives. But you have no way to guess that? Well, sure you do. Because the administration of vaccines is subject to record-keeping. So when the number of positive responses to the questionnaire is unreasonably higher than the number of vaccinations actually delivered, then you could try to adjust for the error rate of false positives.
Like Dr. House always liked to say, "Everybody lies."
There are some significant issues with the cdc data broken out by race.
First, as has been mentioned, there are too many where race is missing. And the cdc method of just assuming that those are in same % age is nuts . From other issues, the missing are usually disproportionately whites. So likely whites have a higher share of those without race data than those that do. For one thing, whites are more likely now to resist giving a racial classification or simply lie and say they are minority .
Second, racial categories are fluid due to multi racial groups and vagueness in definitions ( like is an immigrant from Spain Hispanic) . And the self classification of race can differ depending on context. The denominator used are census numbers from total population and maybe someone would be a little more likely to identify as amerindian if getting vaccinated than with last census. Amerindian identity is especially iffy as so many have just a partial such ancestry such as one great grandparent and whether they say they are anerindian can change easily. That might account for some of the very high reported rates there.
Plus if you think that the census undercounts minorities, then you have to concede that their vaccination rate is also inflated to the same degree . That is just math. And this is obvious some places with a lot of Hispanic illegal immigrants where the reported vaccination rate is over 100%. Clearly that is because the denominator re total population is too low.
And our vaccination numbers themselves are off. Quite clear that a significant number of 2nd shots got reported as firsts and many boosters got counted as first or second shots .
I would guess cdc vaccination rates are likely too low relative to other groups to some extent due to these factors. But don't ask me to estimate how much . The data just too imprecise.
But still better than stupid polls where the vaccination rate is clearly too high no matter how far off cdc data might be. You cannot expect that a poll is going to give you accurate numbers asking about something where many admit the true answer is the " wrong one" and they agree they are in the wrong . Or at least think that others feel their status is " the bad thing". Similar to polls of who voted - they are always higher than actual votes.
But those who are not vaccinated because they feel they are right not to do so, and are supported in that belief by the " tribe", will not have that incentive to lie and say they are vaccinated when they are not. In fact, some Republicans will lie and say they are not when they are .
Wow, a lot of words from an ignoramus.
If I am such an ignoramus and write so many words, surely there would be plenty of stupid things I wrote which you could pick apart with facts and logic with all your superior intelligence.
But funny that, like scent, you find it easy to throw out the useless insult. But never seem to actually be able to come up with any contrary argument or facts .
Surely I expect there is something in what I posted that can be disputed in a logical way with actual facts and argument. Why don't you try that sometimes if you are able.
Stupidity and foolishness are the two drivers for being unvaccinated, not race. Obviously there are plenty of stupid people in the USA and all over the world. I hope we get another variant which further exploits the stupid gap.
Not sure where kevin gets the idea that the admin data is the officially right one.Itt covers only a subset of states. And it's not clear how the stats get the information. I'd trust the survey data more. For one, the administrative data is significantly less than the actual number of people vaccinated. And note, one reason blacks have fewer vaccinations, is a higher percentage of blacks are under 5 and can't be vaccinated, more are between 5 and 18 where less than 50% are vaccinated and substantially less are over 65 where close to 90% are vaccinated.
Reading "Uncontrolled Spread" by Scott Cottlieb. He has a lot on the problems with CDC reports. One lesson for the future--we need to revamp the whole process.
FYI.
The usps site to order your 4 free tests opened today for beta testing one day before official opening. You can order now- I just did and easy. May be jammed up and crash tomorrow so may want to order now
We drove 3hrs out of state for our original shots to a drug store in Trumpistan and then I called health dept. to report and they still harassed me with messages to get vaccinated for months.
Went to a local hospital to be boosted on Nov 22 and I'm still getting texts to get a booster today. I wouldn't be surprised if the discrepancy is due to stuff like that. US data collection has been abysmal since the start and continues to be so.