
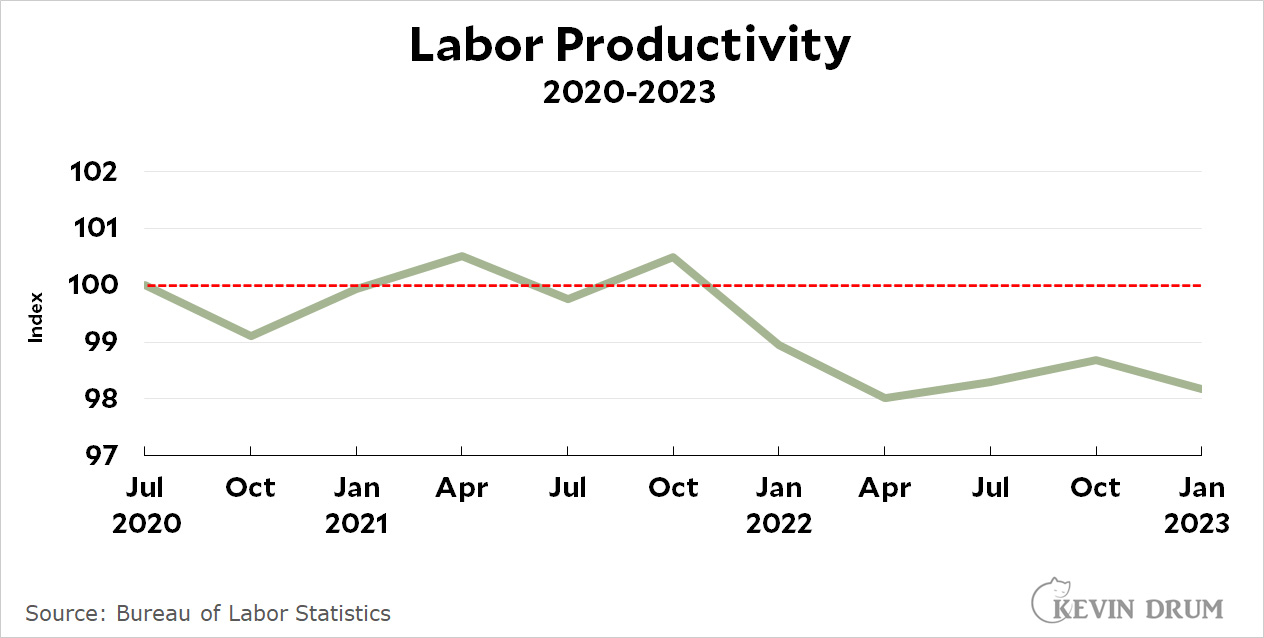
Not much good news today. Labor productivity fell 2.1% in the first quarter, marking the fifth decline in a row going back to October of 2021:
 Hourly compensation is a key component of productivity, so BLS also calculates hourly pay as part of its overall measurements. Thanks to a raft of revisions, BLS now estimates that hourly pay has plummeted since the pandemic:
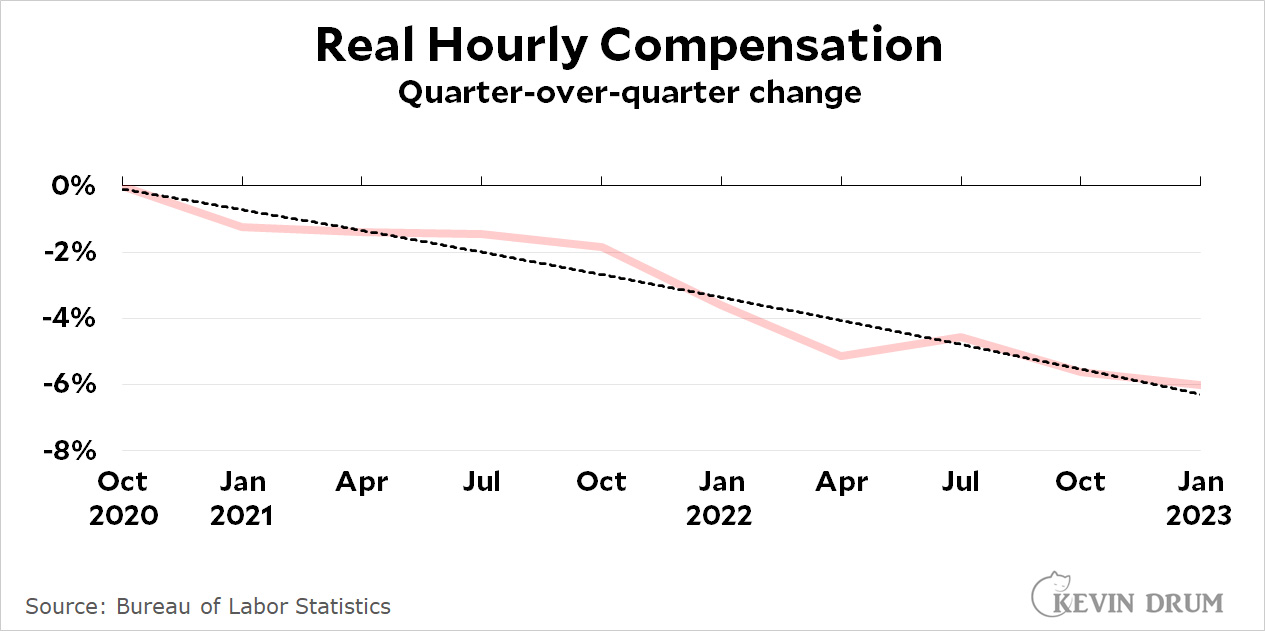 Adjusted for inflation, pay is down 6% since the middle of 2020. And it's down everywhere:
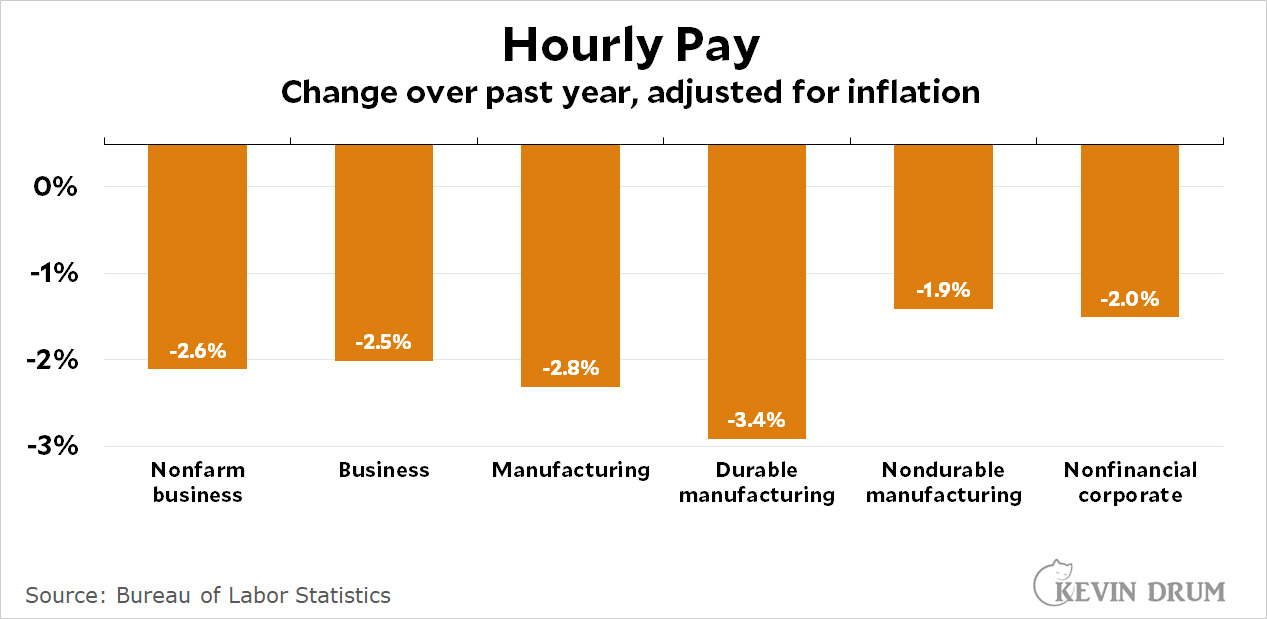 We are all getting paid less and we are producing less for each hour we work. This doesn't bode well for the economy down the road.
As long as Capital is happy with the short term....
Me, reading this piece:
"Hmm, declining labor productivity, that seems ba...wait a minute, why did he start the series in July 2020?"
::quickly googles the series::
"Oh - because productivity shot up 5.7% in the first half of 2020, presumably because a bunch of labor-intensive in-person service jobs disappeared, and the decline we see starting in late 2021 is because the economy opened back up and those jobs came back."
https://fred.stlouisfed.org/series/OPHNFB
What happened to "calculate the trend through February 2020 and then compare where we are to that trend?" Isn't that your rule, Kevin? Or is that only your rule when it makes the point you've already decided to make?
This seems misleading at best. "Dishonest" seems more appropriate.
Pretty much the same story with hourly wages, by the way, though it looks like we're a bit below pre-pandemic trend on that metric. Only a bit though, nothing like what Kevin is showing here by starting at the peak.
Still, inflation is eating too much into nominal wage gains. We need to fix this. Inflation is bad.
Also!
Labor productivity is a measure that is adjusted for inflation as it is a measure of the value of the items produced by labor. Once you know that, then the chart becomes a bit of a "duh" - especially since we haven't been experiencing a true inflationary period but simply a price gouging period where the capitalist class decided to try to squeeze as much as possible out of the market. And use the kernel of truth that there was some inflation as cover - it's just that the kernel of truth is buried beneath a pile of bullshit.
Productivity is erratic on short time scales. It tends to decrease in recessions, as firms are slow to fire, and increase in recoveries as they are slow to hire and there are other temporary factors which influence it. Probably conclusions should not be drawn about productivity trends less than several years in length.
Hmm, we are all more productive at home? Who would have thought?
This too. Employers really underestimate how much commuting to/from work sucks from your energy levels every day. After suffering an hour or more commuting, you just want to do nothing for an hour or more at your desk.
Spot on. I only now have a 20 min drive but I do feel I was far better at home. The numbers back me up too. Can’t tell the jackasses and fearless leaders here, who seem to need control more than productivity.
Shocking. Employers don't keep paying their employees in line with inflation even though employers are generating record profits, and instead employers run around talking shit about how their existing employees are ungrateful and non-employees just don't want to work... and eventually, existing employees get the message that management doesn't care about them and decide to start slow-walking their job tasks and lowering their productivity. You get what you pay for, employers. If you want employees to actually care about job performance/productivity and not just put in the bare minimum to not be fired, you're gonna have to make sure your employees' living standards aren't stagnant or declining. One or two years of pay increases isn't gonna placate workers.
Labor productivity is a measurement that is adjusted for inflation. That chart is less about people slacking off and more about the application of a higher inflationary rate to the same level of output.
That's nice but irrelevant to my point. Labor productivity may be adjusted for inflation. Workers' earnings certainly aren't: most of the time... outside of the 2020-22 period, all evidence shows that workers' earnings have no relationship to inflation - they generally are stagnant until a crisis/strike happens that boosts them temporarily, then they stagnate again until inflation eats them away.
Perhaps the pandemic finally woke up workers to the fact that they should just put in the bare minimum amount of labor possible to keep their jobs, because the boss certainly isn't going to commensurately reward doing more than that. (The difference in pay between the best workers and the meh workers at most workplaces is negligible. For example, in retail, maybe the best cashier makes a quarter more per hour than the rest. Woo-hoo, a whole quarter multiplied by 40 hours = $10 a week or $520 a year! Fck that, just do the minimum and save yourself wrist injuries from scanning items too quickly or whatever.)
I'm not disagreeing that wages haven't kept up with inflation. Nor do I disagree with the broader point that employers writ large want to skimp on payroll while also complaining about quality of workers (you get what you pay for).
I was pointing out that productivity in that chart is adjusted for inflation because you said this: "and eventually, existing employees get the message that management doesn't care about them and decide to start slow-walking their job tasks and lowering their productivity."
The 2% drop in productivity in the chart is just inflation. People aren't actually being less productive.
"We are all getting paid less and we are producing less for each hour we work."
How are CEOs doing across the same period, Kevin?
"We are all getting paid less and we are producing less for each hour we work. This doesn't bode well for the economy down the road."
The data presented doesn't show this at all. It shows that average productivity is down, and that average hourly wages are down. Assuming this data is reliable, is surely at least partly due to the hiring of more people. The people last hired during upturns are typically the least productive, because the most productive already have jobs. Likewise, the people last hired tend to get hired at the bottom of the wage ladder.
Do you have any data suggesting that significant numbers of people are actually being paid less than they were a year ago?
Oh wait, the pay is adjusted for inflation? Shouldn't the chart be labelled as such? So this means that nominal average wages are up, but not as much as inflation. But, even people who like inflation, and think the Fed should be targeting positive inflation, should recognize that wages typically lag behind inflation. In fact, wages keeping up with significant inflation is a sign that inflation is built into the economy. Last time that happened, it didn't go well for anyone.
Good points
This is a disastrously misleading post and set of graphs. Yikes.
on a related but seperate note, given how many workers are also homeowners, does the standard inflation adjustment make sense if we are trying to understand how people are faring? If housing costs are the single largest part of the inflation calculation and everyone who owns a home outright or is on a fixed mortgage isn't actually seeing any housing inflation.... what exactly are we when we adjust wages by inflation? Are we more informed or less informed?
As others have noted here, labor productivity is down because the service sector has been recovering and hiring more relatively low output workers. Productivity went up when the entire sector was clobbered by COVID.
What I find interesting is the divergence of productivity and GDP output per hour of labor. I did a plot over at FRED:
https://fred.stlouisfed.org/graph/?g=15J17
The blue line is inflation adjusted GDP divided by full and part time hours worked. The red line is the OECD productivity measure. Productivity was pretty flat after the 2008 crash. We never really recovered thanks to austerity politics, but that's no surprise. I don't see productivity going down during recessions, which, again, is no surprise.
On the other hand. If you look at the long term trend since 1948, there was a pop in the 1990s. Didn't Clinton do some hocus pocus? The 90s were a pretty interesting decade. It's when the modern Republican party was created and its modern ally, Russia, lost its empire. It's an era of falling crime and increasing prosperity. It was also the start of a cultural relaxation and a dramatic change in how children were raised.
mmm... Labour productivity measures are something I am getting very cynical about in my old age. Particularly economy wide measures. What are we actually measuring? If I am talking about a factory producing standard widgets I can believe that I can measure changes over time (but what about where the components come from - how do we cope with them being imported or domestically produced)? And I dunno - I am also becoming increasingly skeptical - (and I'm not alone in this) - that market price actually has much to do with value.
Also worth noting - 6% fall in real hourly compensating 2% fall in productivity - so that wedge keeps expanding?