
Every year the boffins at the USDA Economic Research Service tot up the amount we spend on food from different kinds of outlets. On Tuesday they released final figures for 2022. Adjusted for inflation, here's the growth in nine categories since 1997 for food eaten at home:
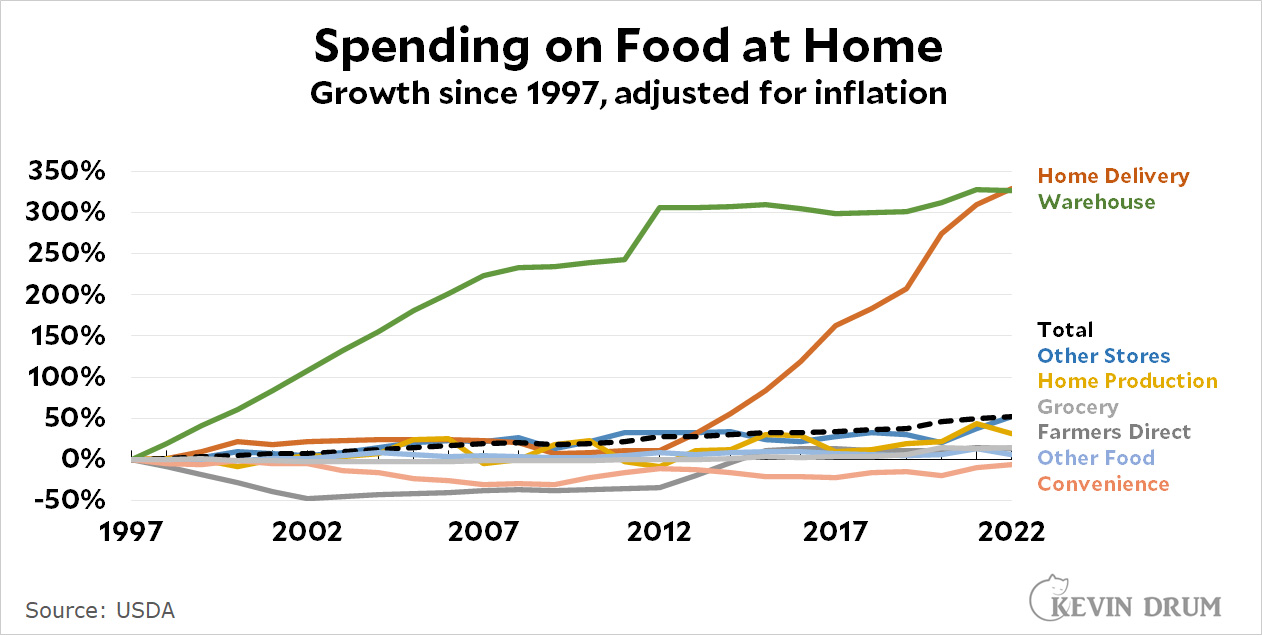 In absolute terms, grocery stores remain by far the biggest sellers of food to be eaten at home. They clocked in at $554 billion in 2022, more than twice the amount of the runner-up, warehouse stores, at $229 billion
One interesting item in this chart is that although we think of home delivery as a pandemic thing, it actually started skyrocketing around 2013. In fact, the onset of the pandemic barely changed its growth rate at all.
Also, note that even adjusted for inflation, total spending is up 52% since 1997. But check this out:
 Even with food spending up substantially in absolute terms, it's still a smaller percentage of our incomes. This is a pretty good indication that our standard of living has improved considerably in the past 25 years.
I wouldn't be so quick to conclude that our standard of living has improved because food spending is a smaller percentage of our incomes. That's very likely because housing has become a larger percentage of our incomes. It's not likely that the percentage formerly spent on food is being saved or spent on costly vacations.
Yes, look at Figure 3 in this Brookings report. Some things have gone down but housing and healthcare have gone way up.
https://www.brookings.edu/research/where-does-all-the-money-go-shifts-in-household-spending-over-the-last-30-years/
I haven't found a more recent report, but I see no reason why housing costs should have decreased since 2014. Healthcare growth has slowed somewhat, but probably is still more important than in 2014.
The USDA report has a graph for total food expenditure as a fraction of income. There has not been much change since 2001.
Absolutely. The decrease in the amount of spent on food at home, between 1997 and 2020, has to have been caused at least in part - if not totally - by the increase in spending on food **away from home**. Similarly, the rise in spending at home, in 2021 and 2022, has to reflect, at least in part, the number of restaurants that were closed.
Just so that we're clear, when you adjust for inflation, are you using their constant dollar to show % change since 1997, or are you taking nominal and applying inflation deflator prior to % change?
How is anyone in the middle class spending under 6% of their income on groceries? For a median household of two people and $5000 per month in disposable income, that’s only $300 a month! We spend double that per person in our family, and we eat little meat or other expensive foods, our kids are you and eat relatively little.
I cannot believe the typical person is spending $1.50 a meal nowadays. That’s pasta and store-brand red sauce seven days a week.
Pingback: Updated: Household spending on all food through 2022 – Kevin Drum
I can make two hundred USD an hour working on my home computer. I never thought it was possible, but my closest friend made seventeen thousand USD in just five weeks working on this historic project. convinced me to take part. For more information,
Click on the link below... https://GetDreamJobs1.blogspot.com