Here are the number of workers who have gone on strike during each month since the start of 2000 through August of 2023:
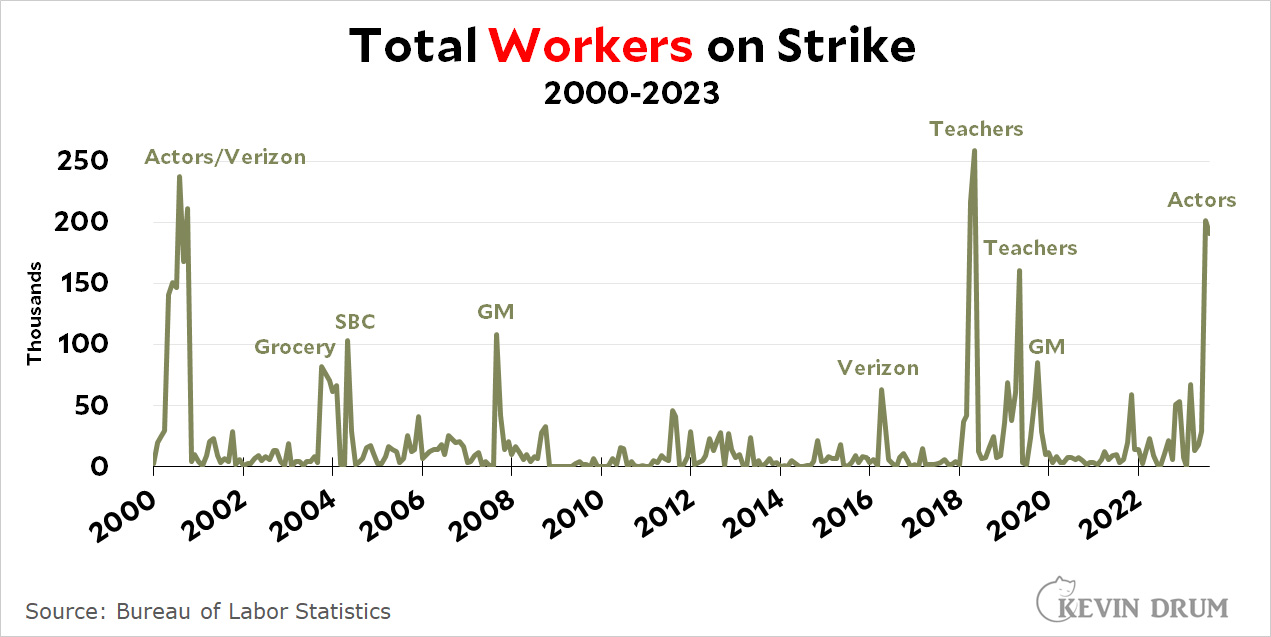 Generally speaking, years with a lot of workers on strike include one or two big strikes, not a whole bunch of smaller ones. A variety of industries are involved when you look at things from this perspective, which counts workers no matter how long the strike is. Things are different when you look at the number of workdays lost to strikes:
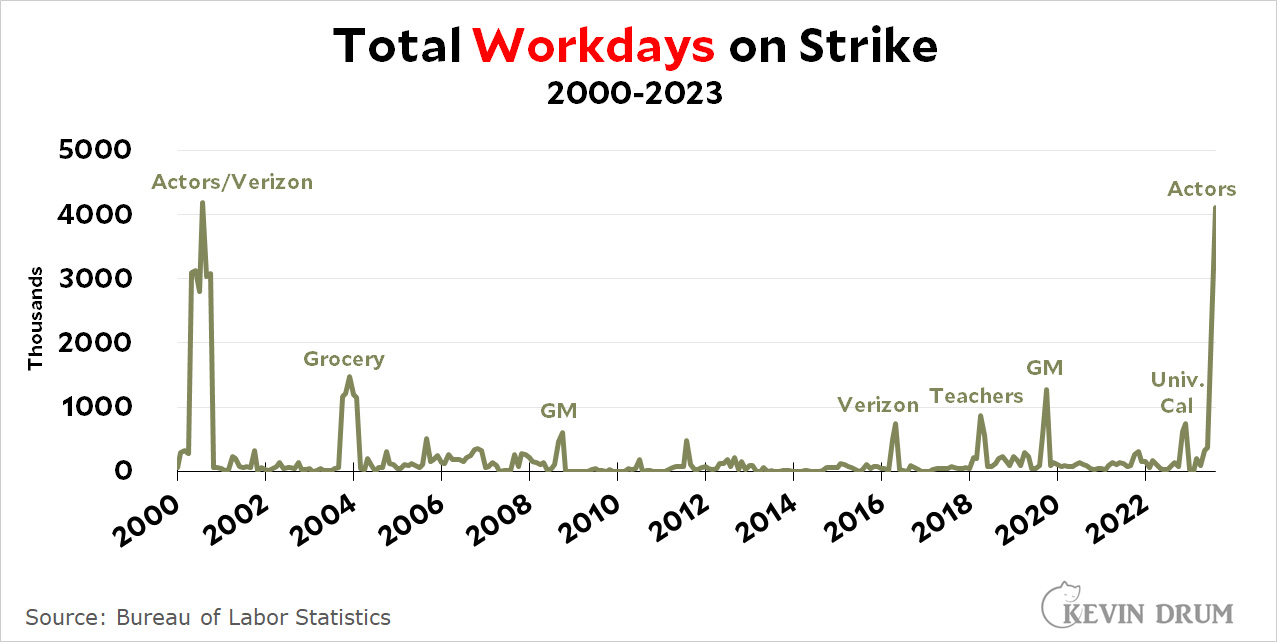 Now it's all about the actors. Since 2000, the only months with more than 2 million workdays lost are those with strikes from the actors guild. The teacher strikes in particular look much smaller than before because they were very short.
Nickel summary: There's nothing very unusual about 2023 except that we're having another strike by actors. The numbers will spike up a bit in September thanks to the UAW strike.
POSTSCRIPT: In case you're curious, here's how 2023 looks without the actors strike:
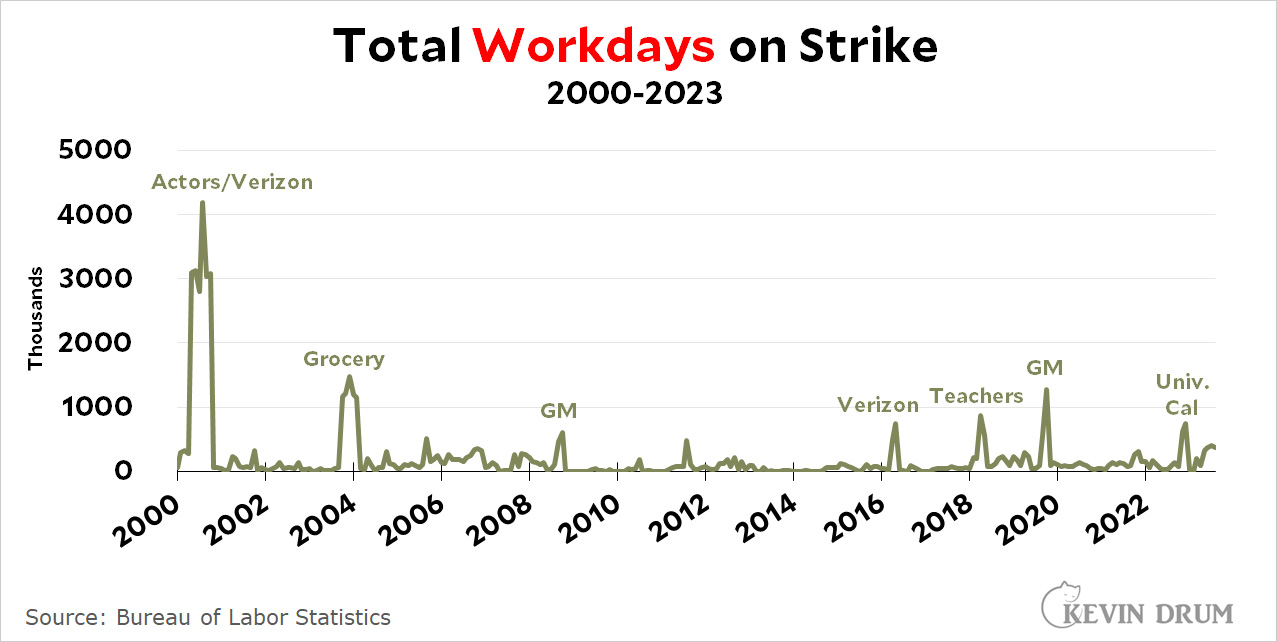 The small bump remaining is nearly all due to the writers strike. Aside from Hollywood, 2023 has been a very normal, low-strike year.
You're overlooking the possible California Faculty Association (CSU faculty union) strike, which is about 29,000 workers strong.
The scale and type of chart used make it impossible to conclude anything.
How much more or less activity is occurring in the first 2/3 of 2023 compared to past years? compared to a normal year? If we exclude the biggest strike each year ( for reasons unknown), how does it compare?
Who knows......these charts sure don't answer any questions and that allows the designer to suggest his/her own conclusions and pretend that the chart supports it.
If the three automakers strike, wouldn't this year be the largest in your chart?