
Via the New York Times, here are the increased odds of dying from COVID-19 if you remain unvaccinated:
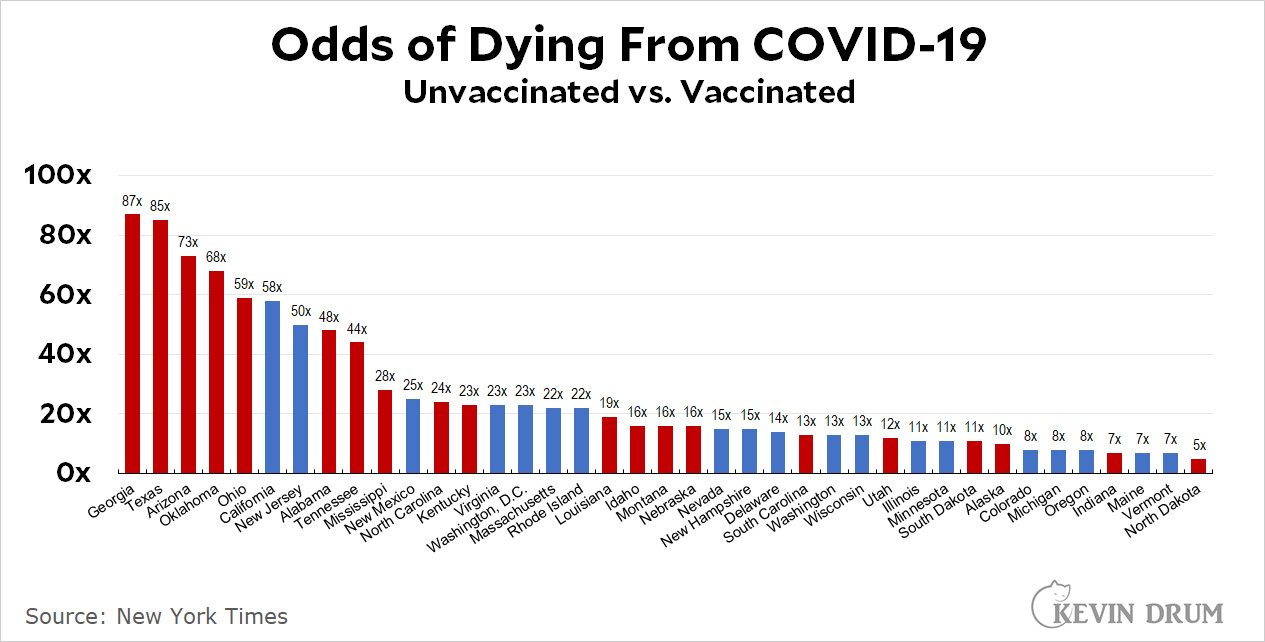
In Georgia, the unvaccinated are 87 times more likely to die than the vaccinated. In North Dakota the number is 5x. For the nation as a whole, it's probably around 40x.
They seem to have lost Florida?
Would that be so bad? 😉
I'm counting 38--so they are missing a bit more than just FL, IA, NY and PA for example. It may depend on what information is available.
From the link:
>> Data was not available for several states in which the virus has been surging, including Florida and Missouri.<<
It's just a matter of time, with sea levels rising and hurricanes growing bigger and more frequent.
The NYT reached out to the public health departments in all of the states to get that data. Some didn't respond or didn't supply usable data. Surprising precisely nobody, that included Florida.
What explains the differences across states?
Just a guess, but I'd imagine it's level of endemicity? Look at Vermont: its relatively low population density combined with high rates of vaccination plus continued use of masks and avoidance of obviously risky behaviors (ie, indoor crowds) means even the unvaccinated are comparatively unlikely to get infected (which in turn means comparatively unlikely to die of covid). So being vaccinated there isn't quite the risk reducer it is in Texas.
But if the chart just compares the death rates of vaxed again unvaxed shouldn't those be more similar? I'd assume the rates of infection would vary, but just comparing death rates should be closer (I would assume).
PS: I can't believe I actually miss Coral at this point...
They are presenting it as death per 100,000 (population of either vaccinated or unvaccinated), not as percent infected or hospitalized for each group. The article also lists hospitalization differences. Comparing them to the differences in death rates is a little tricky since there is a lag between hospitalizations and deaths. A quick glance show ca. 10% of those hospitalized are dying, and not a huge difference at that point between vaccinated and un-vaccinated--but a proper analysis would be needed.
My guess is the roughly the same as Jasper’s. It’s simply less dangerous to be unvaccinated in Vermont because of the physical situation and because Vermont is actively pursuing public health measures designed to combat the spread of the virus whereas states like Florida and Texas are working to create optimal conditions for the pandemic to continue until it burns itself out.
@haddockbranzini
But if the chart just compares the death rates of vaxed again unvaxed shouldn't those be more similar? I'd assume the rates of infection would vary, but just comparing death rates should be closer (I would assume).
I don't see how that would be the case. Obviously the death rate from covid is going to be a lot higher (infinitely higher, in fact) among people who get infected by the coronavirus vs. people who don't get infected by the coronavirus.
I believe what you're thinking of is all people (vaxxed vs. unvaxxed) who get infected. But these charts just detail all people (vaxxed vs. unvaxxed) including those who don't get infected.
So, the probability of getting infected (and ultimately dying) by covid is, all things equal, going to be higher in states where covid is rampant than it states where it's under a better level of control. Which in turns means the vaccines have the biggest impact on covid mortality in those areas where the virus is most dangerous.
I thought the chart was just people who got covid though.
I thought the chart was just people who got covid though.
That's not what the chart says, nor Kevin's headline (nor common sense). If your interpretation is correct, America has some utterly staggering differences in medical efficacy!
What he said:
"But if the chart just compares the death rates of vaxed again unvaxed shouldn't those be more similar? I'd assume the rates of infection would vary, but just comparing death rates should be closer (I would assume)."
I wish we had a Like button
In wondering the same thing.
Differences in medical care quality? Doctors and hospitals are equal across the states - maybe in some of the lower medical quality states, it takes longer for the staff to diagnose you with covid, administer the correct treatment, find you a bed if you need inpatient care, not allow you to catch some other disease while you’re admitted… there are a lot of things that can go wrong if your medical staff and facilities aren’t as well funded as they generally are in richer or more educated states.
*doctors and hospitals are NOT equal…
Could be partly due to how many people over 50 are vaccinated. If you have higher vaccination rates for your elderly population, you'd have less deaths.
Prevalence is probably a factor, too. The quicker it is spreading, the faster it will get to the more vulnerable segments of the population.
5 to 87 is a bigger range than I would expect, though.
I would also look at outbreak timing. Do vaccinated deaths occur faster because if it's not quick, the immune system has a better chance for recovery or slower because you get a better fight early? If a states outbreak started earlier or later could change the mix in ways I don't know.
Looking at the article, the biggest factor is likely the small number of vaxed deaths. Georgia only had 21 breakthrough deaths. A single outbreak that may cause just a few deaths can change the numbers a lot. The error bars must be huge.
The second factor I would look at is the age breakdown of vaxed versus unvaxed. If you have all your old people vaxed and few younger, the vaccine will look less protective.
There’s also evidently a somewhat random distribution of super-spreaders who are likely to spread the virus to many people. When this is combined with prevalence, my guess is that risk is generally lower in areas of low prevalence which also means that even risky activities are less risky in places where the virus is under control.
It's a good question. The only thing that I can think of is differences in age distributions of the vaccinated and unvaccinated populations. But I have no reason to think there are large differences in that from state to state. Maybe it's just data collection problems, or random variation having an exaggerated effect given that the number of deaths in vaccinated people is generally quite small.
Hey--FL and LA have broken the century barrier--both have more than 100 new cases/day. Two more states, MS and AR have severe outbreaks, i.e. >75 new cases/day. An the numbers are still growing--though rates of growth are down from their highs. And in the hard hit states, vaccinations are on the rise.
But we don't need no stinkin' maskes!
(yeah, but badges is two syllables, no masks becomes maskes)
Can some of these governors be prosecuted for crimes against humanity?
There is nothing stopping the people in Florida from getting vaccinated:
>>COVID-19 cases are rising in Florida, fueled by the spread of the more contagious delta variant.
“We’re seeing long lines in testing sites again. Lines for vaccines are short and the shots are easier to find, too. Besides county-run sites, many pharmacies have Pfizer, Moderna and Johnson & Johnson vaccines in stock.”<<
https://www.miamiherald.com/news/coronavirus/article253412880.html#storylink=cpy
Yabbut first they said we didn't need masks and then they said we did, and then we didn't and now we do again, so they don't have any idea what they're talking about! Also, I feel fine, never get sick, why should *I* be an experimental monkey for some drug that's only been out there for less than a year? And anyway it's all fake numbers cuz the hospitals get paid more money to say they have covid patients -- I heard the REAL number is like just a few thousand. And besides lots of people die of the flu and we never hear about masks for THAT! Anyway I'm not gonna let some elitist gummint "scientist" tell me what to do with my FREEDOMS! I'm right with the Lord, and all will be well.
In other words, hmm, wildly disparate risks leading to mass death. Interesting! Won't matter a damn to the people who need to hear it though. On to cats.
Also, while vaccinated people are dying in much smaller numbers from the delta variant in comparison to the unvaxxx'd, that means the vaccinated & unvaccinated alike are dying. Ergo, both sides do it.
(& if I may, I want to give the lamestream media credit for reporting fairly & accurately at the time on Bush-43's response to Katrina, & in so doing breaking thru the fog enveloping his administration after 9/11/01. But the lamestreamers erred in perpetuating their standard of, having reported a GQP misstep, needing to even it out & find a Democrat analog, such that the Heritage Foundation & American Enterprise Institute wouldn't "conveniently" forget the safeword at the monthly lamestream media & conservative thinktanker cocktail parties. Thus the now 13 year hunt for Obama's Katrina... which only pauses when the lamestreamers play along with the far right argument that Katrina was Obama's Katrina.)
I can't access the article, but on the face of it these numbers seem too high.
Georgia's vaccination rate is ~40%. It's COVID rate is ~12%. About 25% of the population is children. Assuming that those who have had COVID are about half vaccinated also (a sheer guess), that means vaccinated + immune due to infection + children (all very unlikely to die of COVID) is 60%. Add on that vaccination rates rise with age, and age increases susceptibility to COVID--and the effects of vaccination seem too high given all the other info we have.
Did North Dakota basically let Covid-19 run wild last year, like Kristi Noem did with it in South Dakota? That might be the best explanation as to why it "only" has 5 times the death odds, and fits with the high death rate (1 in 495 North Dakotans has died from Covid-19, slightly better than South Dakota's 1 in 432 but not by much).
Maybe they're indeed closer to herd immunity in ND, if that's what you're referring to. Low population density might also have something to do with it, as well as low levels of comorbidities in the population. I also wouldn't be shocked if, despite underwhelming vaccination levels, they're vaxxed numbers are very heavily concentrated among the elderly.
The pandemic was worse % wise in the rural counties because Fargo/GrandForks have enough liberal folks so the rest can free ride.
Not like Noem no. Schools went largely remote or hybrid, cities were allowed to issue mask mandates, large gatherings were banned. More importantly for deaths elder care homes were locked down early and for a loooong time. The hospital system was stressed but never got overwhelmed.
Fargo, with 1/5th the state's population has a dem mayor and just enough sane folks on the city council to make it work. In fact Fargo just announced masks will be mandatory when school opens.
North Dakota basically represents what happens when a red state does mitigation but 70% of the population doesn't care. People got sick but they were able to get the medical attention needed.
That's a good point. The fraction of the unvaccinated who have had prior exposure probably would be higher in North Dakota than in a lot of other states.
Any thoughts on Israel's reports that they're seeing Pfizer effectiveness waning (I think they've said they're down to 39%) against Delta? They're seeing a significant effectiveness drop-off when you get to 6 months. To be fair, this is just for breakthrough infections, their vaccinated people are still being protected from serious illness.
I expect WHO (et al) to try to downplay that as much as they can as part of trying to keep countries from issuing booster shots until a much, much larger fraction of the world's population is vaccinated. That said, I don't think WHO will be able to downplay it for much longer, between what the Israelis are seeing and what other countries are doing (issuing boosters to at least selected subsets of their populations).
https://www.medpagetoday.com/infectiousdisease/covid19vaccine/93982?xid=nl_mpt_DHE_2021-08-11&eun=g1700464d0r&utm_source=Sailthru&utm_medium=email&utm_campaign=Daily%20Headlines%20Top%20Cat%20HeC%20%202021-08-11&utm_term=NL_Daily_DHE_dual-gmail-definition
First I think Israel is actually doing some real random testing, unlike the usa unfortunately, to get a better idea of what is going on. So they are seeing all the asymptomatic and mild cases in vaccinated that we are missing as they never got tested.
Second, Israel did vaccinate earlier so any loss of vaccine effectiveness over time will be more noticeable there.
But this is the pattern I would expect. Especially for vaccine or a mild covid case, the body's immune system cannot just use up so much of its capacity making antibodies forever. It needs to be ready to deal with other viruses and bacteria too. So perfectly reasonable to let antibodies wane over time but the immune system will still retain a memory of how to make antibodies so it can ramp up if infected again.
So expected result is that after a while you can get infected again and even infectious but if the new antibodies kick in quickly, your viral load should decline quick which will mean you are not as infectious and will not get that sick.
For those who got covid and got very sick, I would expect the immune system to keep making antibodies for longer. Covid then is enough of a threat to make the extra effort worthwhile.
Presenting it this way is going to confuse a lot of people. In a community where 90% are vaccinated, even a 90% effective vaccine could show a 50% "odds" of dying among vaccinated.
Even just changing the description to "incidence" rather than "odds" of dying helps clear that up a little.
But what you really want to know is the relative risk of death among vaccinated positive cases, which is hovering around 0.1.
Where did you see that. 1 relative risk number among positive cases? Is that adjusted for age?
Does seem well within a reasonable bounds to me.
But note that, if you are trying to assess relative risk of dying, you would need to also incorporate the relative risk of catching covid and having a positive test.
I think the efficiency on that measure is much better than 50% , so, if efficiency of not dying if a positive case is 90%, the relative risk of dying is likely much better than 5%.
Here as you are starting with relative risk of dying with a reported case, we are ignoring all the asymptomatic or untested cases. But any difference there cancels out.
Since the article is behind a paywall, cannot see the details.
But totally clear that no way, 0% chance, that this huge disparity is real , even if you try to adjust for differences in vaccination rates for age,etc.
So I think the only conclusion has to be that whatever the ny times is reporting here is basically junk statistics and the state disparity has to do with either states reporting different things or that there is a bias ( probably toward making it seem vaccines are more effective than they really are) that is skewed differently between states.
Without being able to see the full article so going out on a limb. But I have seen some of the reporting in la county and can relate how stupid it is. It has been reported that you have an x % chance of dying from covid if vaccinated and calculated by simply dividing the total who died from covid while vaccinated by the total number currently vaccinated. That is just a garbage calculation as it is only the chance for a slice of time to date and you would have to divide by the average # vaccinated for the period, not the end number. And, if you are trying to compare vaccinated and unvaccinated risk, you would need to use the same period of time and also weight by prevalence for the relative numbers at any date.
La county has made a big deal of comparing the number of covid deaths for all of 2021 for unvaccinated , divided by current number of unvaccinated today. Vs. the same for vaccinated. But that is meaningless. For the large death spike in early 2021, there were not that many vaccinated, so of course they were not dying then.
So I wonder if some states were reporting things differently to the ny times
And, say all states used that silly number based on all of 2021. The bias would be higher for states that had a larger relative death numbers in early 2021 as compared to after the big vaccine push.
La county has occasionally reported the relative statistics for a two week period which, as % vaccinated has not been changing much. I have tried to do some seat of the pants adjustments for age ( as higher % vaccinated who are older and have higher death risk, the raw numbers are unfair to vaccine) and I think relative efficiency at preventing death is maybe 95% or 19 to 1 chance. Or possibly better.
I would add I think Kevin is making a basic math error if he is using these numbers as correct and then thinking the us average is 40 to 1.
You cannot just average ratios like that.
For example, say you had two states with equal populations of vaccinated of 1,000,000. For each state the unvaccinated die at a 10% rate. In state 1, vaccinated die at a rate of 5% or 50,000. So relative risk is 2 to 1. In state 2, vaccinated die at rate of 1% or 10,000, so relative risk is 10 to 1.
Is the overall relative risk 6 to 1 by averaging 10 and 2? No. You need to average the 5% and 1% or 3% and then can say the total relative risk is 3.1/3 to 1.
Of course, as I said the starting numbers are garbage anyway.
I agree there are a lot of garbage statistics out there, but the figures provided by the NYT don't strike me as wildly implausible; IOW, I'd expect there to be fairly large disparities in the effect on covid mortality rendered by vaccines in different areas. If, say, covid is raging in Tarrant County, Texas, its seems likely that being vaccinated there provides a larger increase in one's odds of avoiding covid infection (and death) than would be the case in, say, rural Vermont (or, even more so, New Zealand).
To me the Times's take with respect to regional differences in the effect of vaccines on total covid mortality is strongly intuitive; to you (apparently) it's not. I'm wondering if you could shed some light on your reasoning.
Not sure how to respond as the problem is I do not see what your reasoning is. Sort of like asking me why I think the number of people in the state should not make a difference in relative risk. Because there is no reason it should.
We are talking RELATIVE risk here, not absolute. So to say that changes as prevalence decreases, you need to have a reason why that decreases the chance of death for vaccinated more than it does for unvaccinated. And you have provided no such reason.
I can think of one thing but it could go either way. When prevalence decreases, your likelihood of being exposed should decrease of course. But also I would expect the viral load you are exposed to on average to be less on average when you are exposed. Not by a huge amount ( because most exposures will be by one other person) but more covid, the chance of getting multiple exposures from many people at one time should increase exponentially.
So, if vaccine is more effective for high viral doses than for low, what you are saying might be true. I could imagine that if vaccine antibodies do real good fighting off a low viral dose ( almost 100% effective) but can get overwhelmed with a high viral dose. Which would go against your point. But, to the contrary, maybe the vaccibe is not needed to prevent death with a low viral dose ( as normal immunity does just fine there) but needed to prevent death with a high viral dose.
But cannot see either way it can possibly explain these ridiculously huge disparities.
One thing that could explain some disparity ( but not a huge amount) is differing % ages of unvaccinated who have natural immunity from having had covid. To really check vaccine effectiveness, should compare those vaccinated who never had covid vs. unvaccinated who never had covid. And also the same for those who had covid. Have to assume that effectiveness is higher for those who never had covid.
In states that had the largest past outbreaks, I would have to assume the % of unvaccinated who had covid is much higher, even relative to % age of vaccinated who had covid. This will bias the vaccine effectiveness down. And also, even if %age who had covid is the same, just having had more who had covid also biases it down.
But problem in trying to explain this ny times disparity is the lowest are ND and VT. Totally different states.
We are talking RELATIVE risk here, not absolute.
Not so.
We're talking about both: A) absolute risk of death (vaccinated vs. unvaccinated) and B) relative advantage conferred by the vaccines (state vs. state).
If two uninfected, fully vaccinated persons were parachuted into Baton Rouge and Antarctica, respectively, you genuinely don't see how mortality risk would be reduced more for the former?
If you are talking about Antarctica away from any human, yes, because you cannot reduce risk below zero.
If you mean an antartica base with other people, then no.
Maybe the confusion is that you are thinking of the absolute amount of reduced risk, not relative. This is different than the absolute incidence.
Say the risk of dying of covid in Baton rouge was 10% for x period for unvaccinated and the risk of dying if vaccinated was .5%, so efficiency was 95%. Or relative reduction was 20 times. So now I guess what the risk of dying if vaccinated in antartica is if I somehow could know the risk of dying if unvaccinated is .0001% ( or I in 1 million due to some freak event like the virus being on some air dropped package). I would expect the risk then if vaccinated to be 1/20 of .0001% or .000005% with exact same 20 to 1 ratio. Unless there is some reason for the relative effectiveness to change such as the vaccibe doing less if viral load is less. Which you have not provided.
Maybe where you are going off is the absolute reduction in antartica is a measly. 000995% and not the big 9.5% in antartica. But the relative reduction is still 20 times.
If there is something else that should make it obvious that relative risk would be less, no I do not see it and you have given nothing to explain it except assuming it must be obvious.
Consider an analogy. Say an enemy soldier is shooting randomly at your position. You have no shield. And he has a 10% chance of hitting you. Now you get a shield covering 90% of your body so his chance of hitting you is 1%. Reduced 10 to 1. Now imagine he only shoots one tenth as much so chance of hitting you unshielded is only 1% instead of 10%. But chance if you have the shield is now .1%. Yes, the shield is less important if he fires 10 times less but the risk is still reduced 10 to 1.
Maybe the confusion is that you are thinking of the absolute amount of reduced risk, not relative.
I'm not "confused" about this because that's what the NY Times's article is reporting on: the reduction in absolute risk of dying of covid if you've been vaccinated as it varies state by state.
I think your confusion is that you want the article to be reporting on something different from what it's actually reporting on. I mean, all things equal, a moderna double vax should provide the same benefit (in terms of reduced mortality) for everybody. But all things aren't equal from state to state. And that's exactly the point!
Well, the paywall is a problem, but its "odds of dying."
As Jasper said, "odds of dying" is a function of how endemic the virus is in the state, as applied to the known odds of dying while vaccinated v. unvaxed.
You could have a situation where in a certain area there are hardly any cases. In that area (state), the difference between vaccinated and unvaxed would approach zero, because if no one gets infected NEITHER vaxed nor unvaxed have much of a chance of dying.
On the other had, I have seen numbers showing that the vaccine is in the 95% range against symptoms, probably 99% effective v. death.
That would mean that in another area, where covid is rampant, the max "difference in odds" would be something like: "odds of dying vaxed - 1 in 100" as opposed to "odds of dying while unvaxed" 2.5 in 100."
As is typical a of medical science, that's what, a 150% increased likelyhood of dying?
Its pointless because the NYT is trying to point out how dumb it is not to be vaxed. But the audience won't get it so its a waste.
I do not think you are correct that the RELATIVE odds of dying of covid for vaccinated or unvaccinated would be biased based on how prevalent it is, assuming you measured correctly over a period where the % of vaccinated and unvaccinated was stable.
If cases are real low, it is true that the relative chance will be more uncertain as affected by random chance more. But that can go either way. It might distort the true odds up or down.
Where prevalence does make a difference is if it creates a bias as you are not really comparing apples and oranges. If you did adjust for actual numbers of vaccinated changing ( and some do not even do that), but do not take into account different prevalence over time, that will bias. Up until recently, the large bulk of the vaccinated " experience " was at a time of low prevalence ( April may june) while at a time of high prevalence ( jan, feb) there were fewer vaccinated. So even if vaccine was 0% effective, you would show lower average chance of dying per day for vaccinated.
I do criticize the ny times here. Either the reporters and editors are just stupid and did not realize that something has to be wrong with their numbers as disparity between states is impossible. Or they were aware and decided to deliberately mislead to make a " good point".
Or maybe, as probably with kevin, you have a sort of confirmation bias. And this is a problem with so much crap studies. You want to believe that vaccines or very effective and that has become part of your world belief. So any " study" that shows what you want to see, you sort of turn off your thinking and accept it, and do not notice where it makes no sense. If fox news reported numbers showing gun ownership decreased crime but with a disparity among states that was unbelievable, I am sure that kevin and most of the liberal commentators here would have immediately noticed that the disparity indicated something had to be wrong with the underlying numbers..
Ahhh, got it. Guns and Fox and "liberal commentators." That explains a lot.
Sigh.
You just missed the point. I used an example of fox news reporting a study with an obvious mistake and liberal commenters ( you are a liberal and you do comment, right?) Just to give an example you might understand where you would be inclined to notice the stupid error and point out CORRECTLY that it made the conclusions invalid.
And I did it from that perspective to try to not make it partisan. If I gave an example where the liberals made the stupid mistake and the conservatives were the smart ones catching it, I thought that would be more antagonistic to liberals here so they would be more likely to not understand the point I was making.
I went in that direction with my example because I was trying not to make it a partisan point. I see this sort of confirmation bias where conservatives cannot see an obvious problem with their " evidence " the same as I see it for liberals.
One example is the studies that show evidence of fraud in the last election and that trump really did win. Some make a possibly arguable case that some discrepancies raise doubts, but mostly with uncertainty and at a marginal level. But others seem to " prove " that trump won like 10,000,000 more votes than recorded but the " proof " is just obviously illogical. And, if the same person provides one study A with evidence where there are no obvious errors ( so cannot be sure if it is right or not) but then they have study B with laughable errors, I can safely conclude that study A is bunk even if I cannot see an obvious problem. And I have had arguments on this with hard line trump supporters and have been frustrated that these generally intelligent people cannot see the obvious ridiculousness of the evidence they breathlessly point out to me.
Another covid example was a meme that went around a lot of sites in early spring claiming covid was over as we have to already be at herd immunity. I think they were optimistic re the immunity needed for herd immunity, but most were before delta so excusable. And one point that made was that too many were ignoring natural immunity re what we need for herd immunity and I 100% agreed with that. And they did what I felt was a pretty good estimate of total covid infections per state and thus natural immunity. But then they just added their natural immunity %age to % vaccinated to get total immunity which is just elementary stupid. Hopefully I do not have to explain why.
I bet its correct, just pointless. Let's see if we can do California from the article (58 times more likley) and data.
Right now if you divide deaths by cases there has been, over time, a .016 death rate, or 1.6% of those diagnosed die.
So far, the number of cases as compared to the population is roughly 10%, so the "odds of dying" so far, has been .0016.
Now, that number includes spikes, but bear with me. If your odds of dying after being vaccinated are .00027, then you are "58 times more likely to die" if you are unvaccinated.
I would hope the NYT adjusted for "at this time" rather the use cumulative numbers.
But the numbers are correct, just not persuasive for the crowd its aimed at.
I assume you got the .00027 chance of dying after vaccinated by backing into what it needed to be to get 58 times, after knowing what the death rate overall was, correct? If you got the. 00027 independently, then you figured out where the ny times number came from so tell us that.
I would note however that, if it was adjusted somewhat for timing, then you should start with the unvaccinated rate, not the total rate as you did. But I doubt that would make a huge difference.
I really doubt that the times made any adjustment for timing as, if they did, cannot believe they would get this huge disparity. And I think somebody said that some states were missing as did not get a response from all states. So I think they just used what states sent them so different state methods would be unadjusted and make comparisons useless.
Re California, from what I have seen done before, I bet these numbers are based on just 2021, and not cumulative including 2020. Which I guess sounds like a fair adjustment for timing but really is not. Because so many of 2021 deaths were in jan and Feb before many were vaccinated.
One thing I should clarify. I am NOT saying that the ny times numbers overstate the case for vaccines . In fact, I would eyeball a true "average" for us as a whole done correctly as maybe 20 to 1, not Kevin's 40 to 1. And I think that is likely too low from my analysis.
I expect that some states, but not all to the same extent, do have a bias re timing that makes the vaccines look too effective. But I also would think there is a likely bias with a simplistic calculation due to age. And that can be a huge bias the other direction.
Say you so look only at a limited period like a week where the % of vaccinated does not change much ( even looking back 3 or 4 weeks due to lag). And you see death % among unvaccinated is 5 times death rate among vaccinated ( like nd in the chart). Does that mean vaccine effectiveness is 80% . NO. You have to also adjust for the elderly being more vaccinated. Assume that we vaccinated strictly by age and all those over 50 were vaccinated and those under 50 unvaccinated. Would not surprise me then if vaccinated were dying at a higher rate than unvaccinated even if vaccine was 95% effective. Those elderly vaccinated had a hugely higher risk if dying before they were vaccinated.
I did relate my 92 y.o. vaccinated mother got tested positive. My best estimate was that her chance of death was around the same as an unvaccinated 62 y.o. Re covid, vaccination makes you 30.years younger.
So far 3 days past her positive test ( my guess is 7 days after exposure) and my mom still has zero symptoms so encouraging.
This thread is probably over but just in case its not, yes, I just backed into the number by dividing by 58. However, the .00027 is not an illogical number.
As you point out, once it takes more than three paragraphs to explain you might as well give up.
By the way, though, this does illustrate one big problem. If an entire population has about a 10% chance of getting a disease and of that 10% there is a 2% chance of dying, plenty of people will just say "screw it" despite the fact that if you apply those percentages to the entire population the cost in terms of sickness and death is extraordinary. I don't know what percentage of risk is required to get everyone on board, but covid is simply not a high enough percentage. Humans are not rational.
My 90 year old mom was infected in January and recovered after being totally asympotomatic. So hopefully that will be the case with your Mom as well.
Connecting the dots between Covid vaccine hesitancy and Fox News:
https://www.msnbc.com/opinion/connecting-dots-between-covid-vaccine-hesitancy-fox-news-n1276592
Only Fox could profit from killing off their own viewers...
They're counting on the excess mortality in their audience being mostly a rounding error.
Responding to your post above as will not let me respond below it.
The ny times chart is absolutely reporting on reduction in relative risk, not absolute. It is saying that the unvaccinated have x times a greater chance of dying than vaccinated. If it reported that the addititional chance of dying if unvaccinated was x%, or say .5% if unvaccinated have a .6% chance and vaccinated have a .1% chance , then that would be reporting an absolute reduction and of course the amount would be less in areas with less covid.
I cannot understand how you do not see that point.
Not sure if this is to me, but its a mixture of relative and absolute and that is why its close to worthless.
Note that even though California has a high vaccination rate, its near the top of the chart. That is because the main driver is how endemic the virus is in the state.
The relative risk between vaxed and unvaxed would be constant across a large population. That would be just a variant of all of the risk factor stuff we see all the time with respect to cancer, such as "smoking increases your (relative) risk of lung cancer by a factor of X" But the "risk of dying" is a function of whether the virus is actually endemic or not where you happen to be.
I put "relative" in quotes because that sentence only compares getting lung cancer with one variable -- whether or not your are a smoker.
This chart is as if (1) instead of just smoking or not smoking, there was a vaccine against lung cancer, and (2) let's compare places where, if you go there, its all indoors and everyone smokes (where you inhale smoke regardless of whether you have the lung cancer vaccine) v. places where its all outdoors and hardly anyone smokes.
As I have said, the chart isn't helpful in almost every sense but one, and that one is that people aren't going to realize what having a "58x chance of dying" in California if they are unvaxinated means.
The fundamental flaw isn't the chart, its the lack of the follow up question: "58x as compared to what?"
Yikes,
I think I see a basic error you made that I missed before. To get ca death rate, you divided deaths by confirmed cases. But pretty sure from the bit allowed to read from the times, they were talking about chance of anyone dying, not just confirmed cases. But just changes by a factor of 10 as, so far, ca total death rate is .16% or .0016. And divide by 58 and you get .0027%.
The %age of vaccinated who died so far in 2021 from covid is .0008% in la county per their website as of the 10th. 41 out of 5.1 million. I would think the number would be somewhat lower statewide but not a huge amount, maybe .0007%?
So I think. 0027% is too high ( for what I think was used). So go with .0007%. But if you started with that, then the unvaccinated rate needs to be 58 times or about .04% for unvaccinated.
But if you also started with the death rate for the entire pandemic for the entire population. I think the state numbers are also for 2021 only for unvaccinated that they are comparing to. So maybe. 08% ? But also would think you would have to exclude those who are vaccinated from the denominator and if i think they just used unvaccinated today ( a fundamental error), which would maybe get you .04%.
So I think they just compared deaths among unvaccinated and vaccinated in 2021 over the numbers of vaccinated and unvaccinated today. Which is a garbage statistic obviously. I first suspected that because la county's website did the same nonsense but it really does seem to add up.