These are not the most important charts I posted this year, nor do they "explain" 2021. They are the ones that are interesting, unexpected, or tell a story that few people know. In no particular order, here they are.
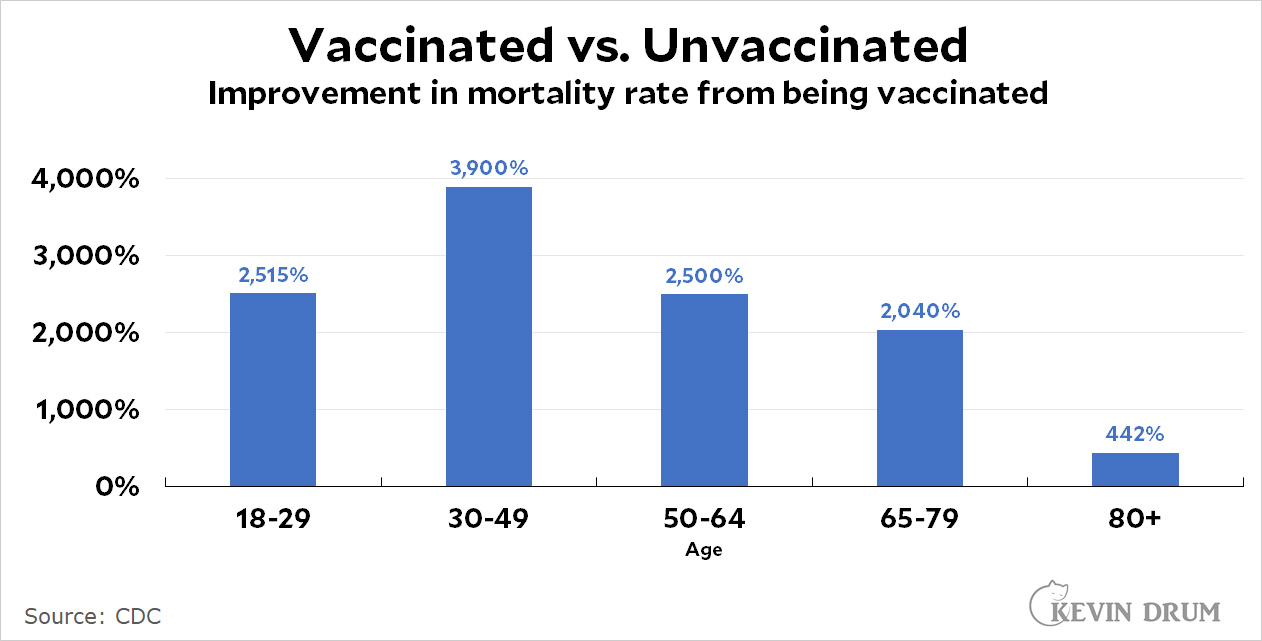
I promise only one COVID-related chart. This one shows the massive benefit from being vaccinated, which only gets stronger if you've also gotten a booster shot. Get vaxxed!
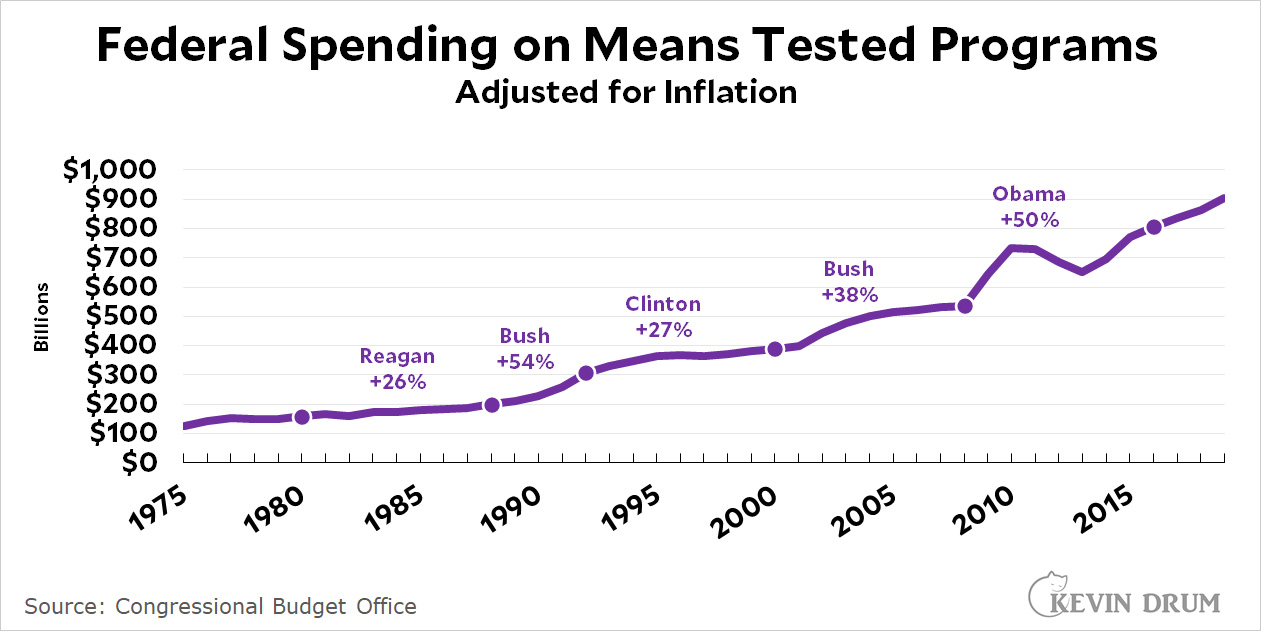
 Liberals like to say that "programs for the poor are poor programs," but it's not true. Means-tested programs are generally popular and are almost never clawed back by Republicans except at the margins. Since the Reagan era, spending on means-tested programs has increased 6x. This includes a 3x increase in programs that distribute cash to the poor.
 Is this chart just a big, fat coincidence? I think not.
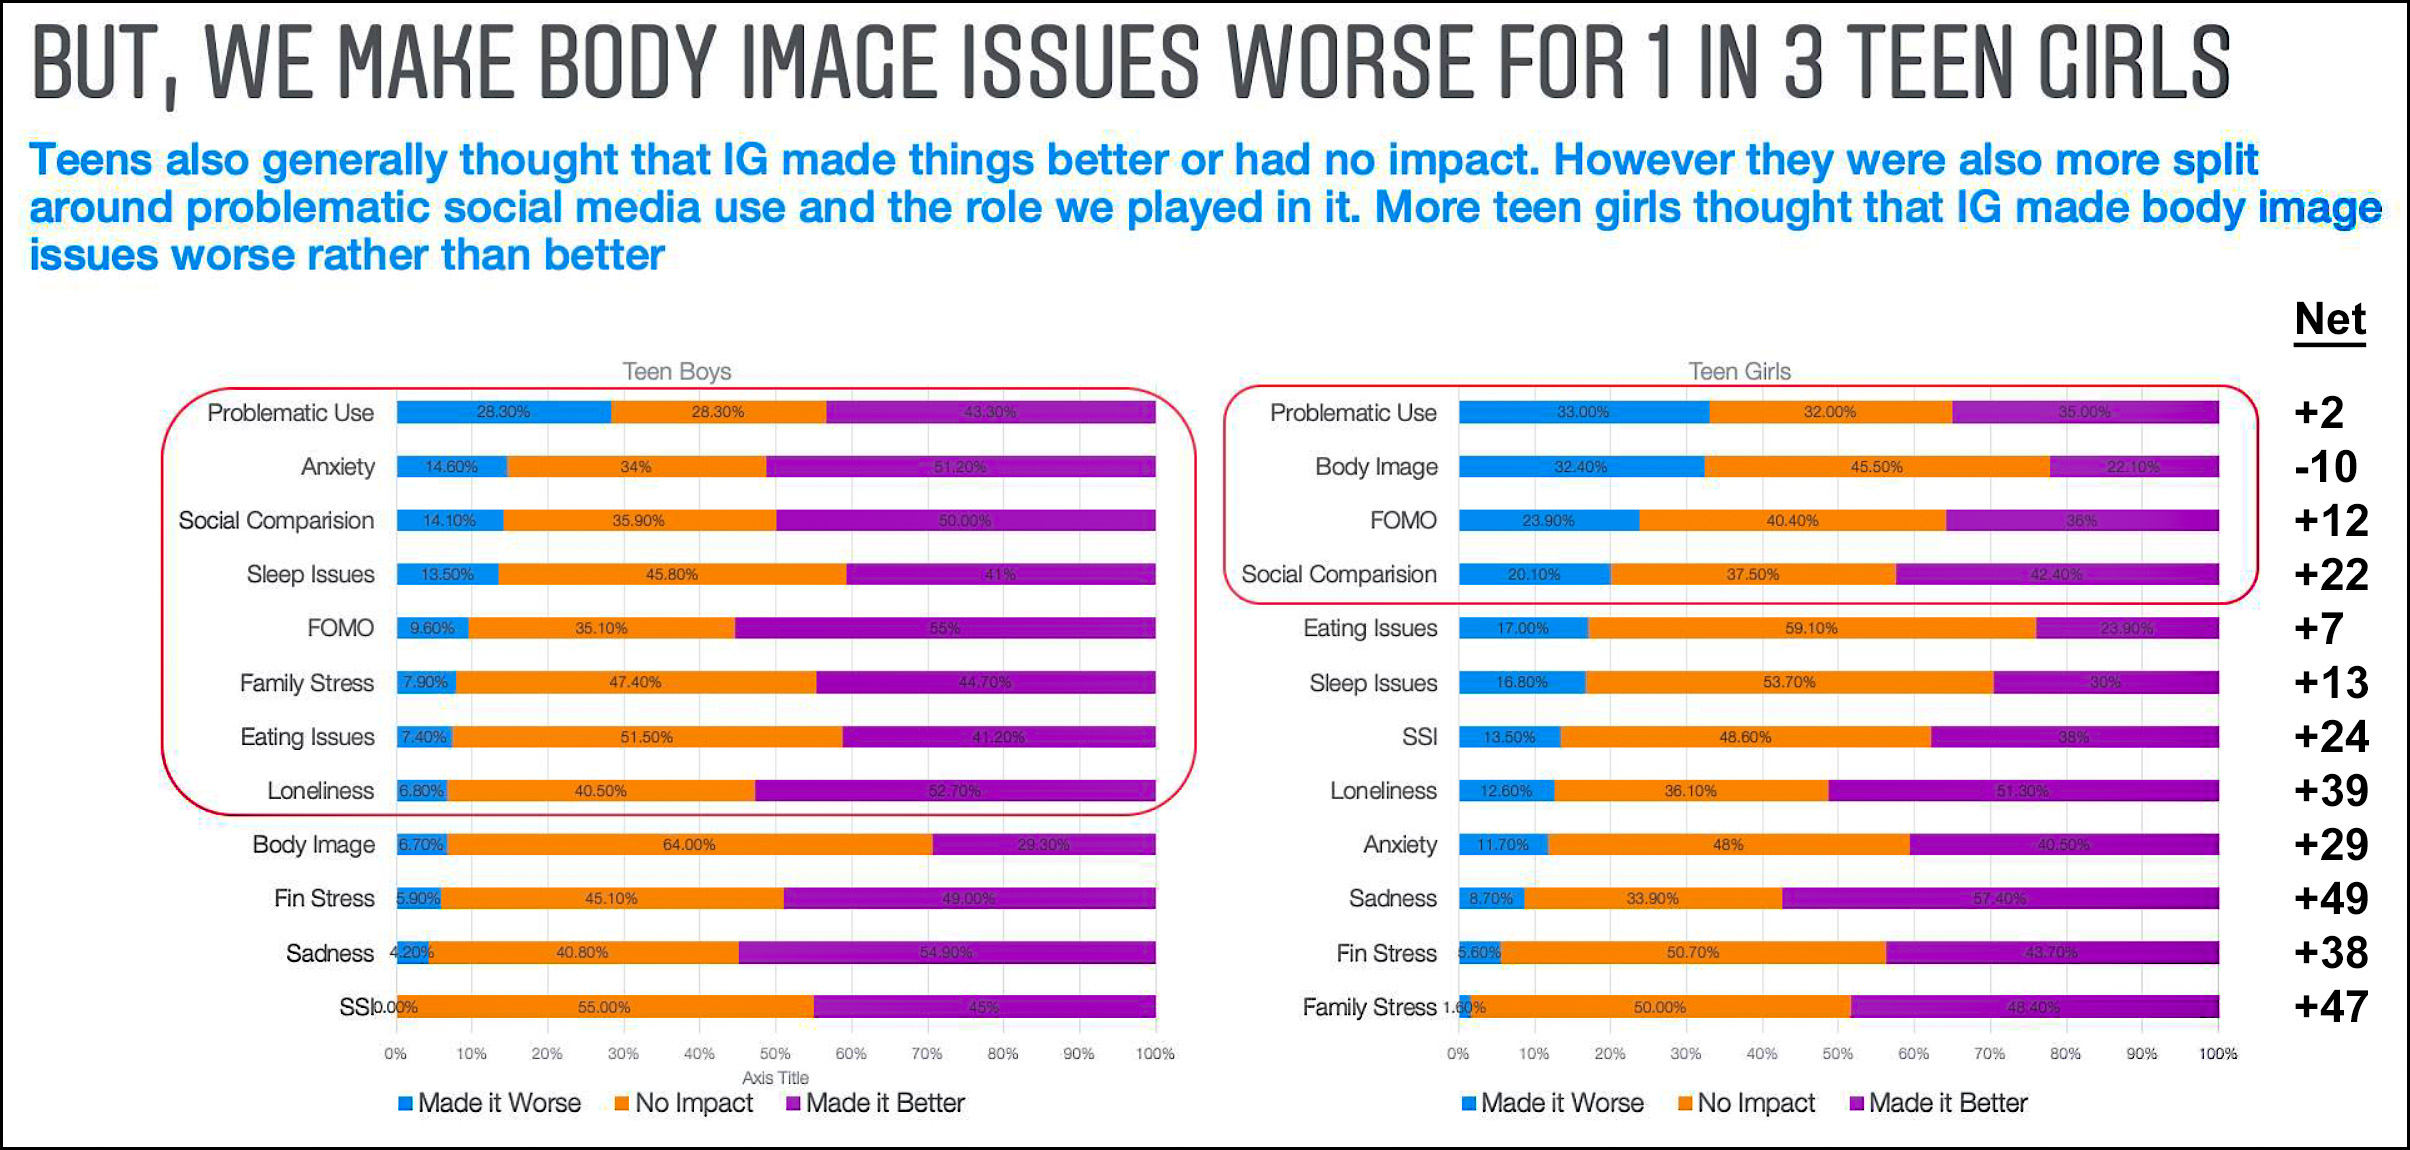
 Here is the "smoking gun" that Instagram is bad for teen girls, but it's almost hilariously just the opposite. Out of twelve issues, Instagram was a net positive for all but one (body image). A thousand think pieces have mentioned that single negative effect, but I haven't seen a single one that, for example, mentions that teen girls find Instagram to be a huge help when it comes to family issues or loneliness.
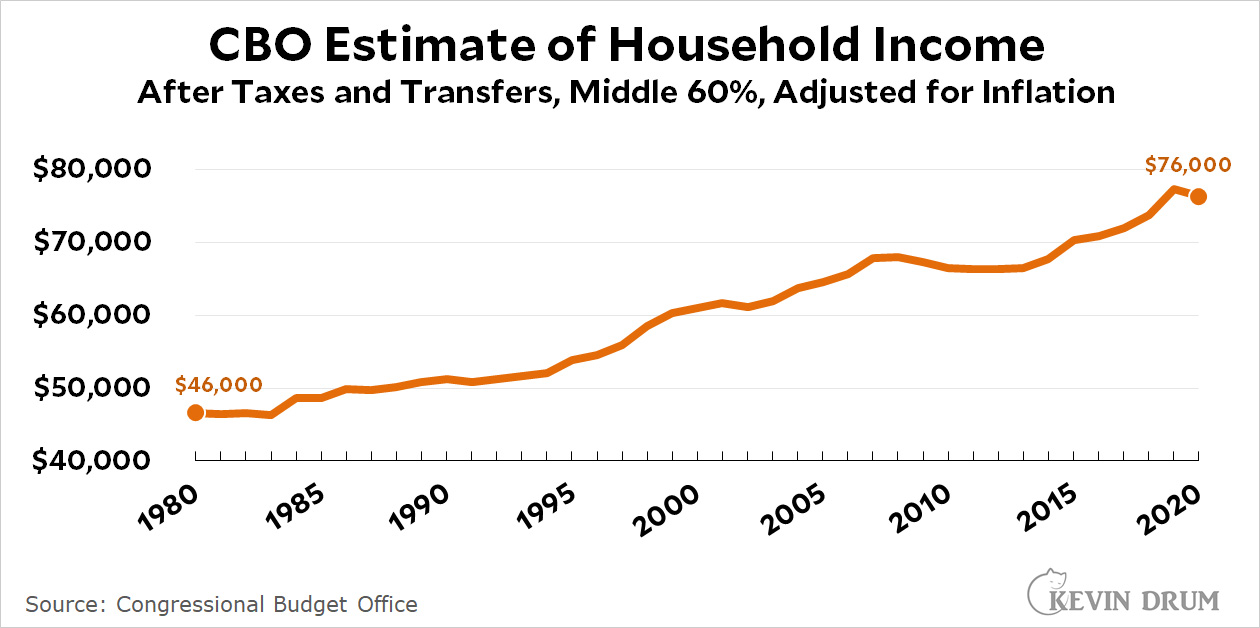
 Middle-class income hasn't increased as much as it should have over the past four decades, thanks to increasing returns to the rich. However, it hasn't been stagnant either. When you account for taxes and government benefits, middle class income has increased about 65% since 1980.
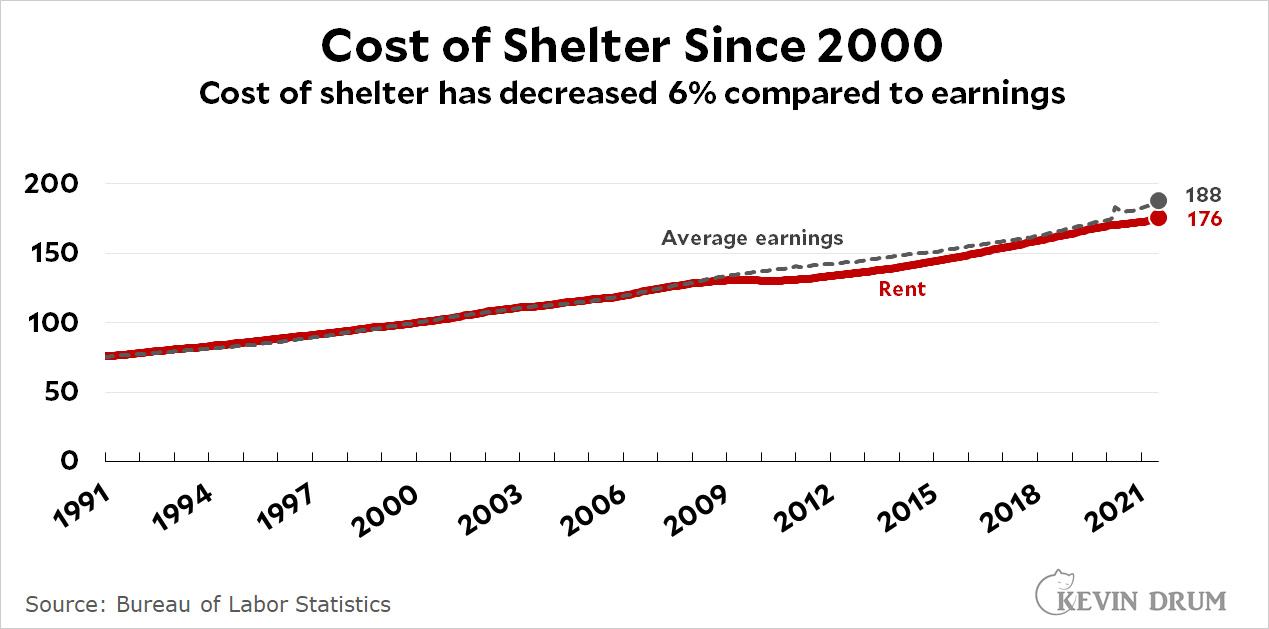
 It's conventional wisdom that housing has skyrocketed out of reach in recent years. However, this isn't true: in general, housing has increased at about the same rate as earnings. What's more, if you account for the way in which low interest rates have reduced mortgage payments, the cost of homeownership has declined noticeably.
What is true is that the cost of housing has soared in certain hot cities, like Denver and Austin. But every decade has its own hot cities and the housing bell curve will always include both big gainers and big losers in the housing market.
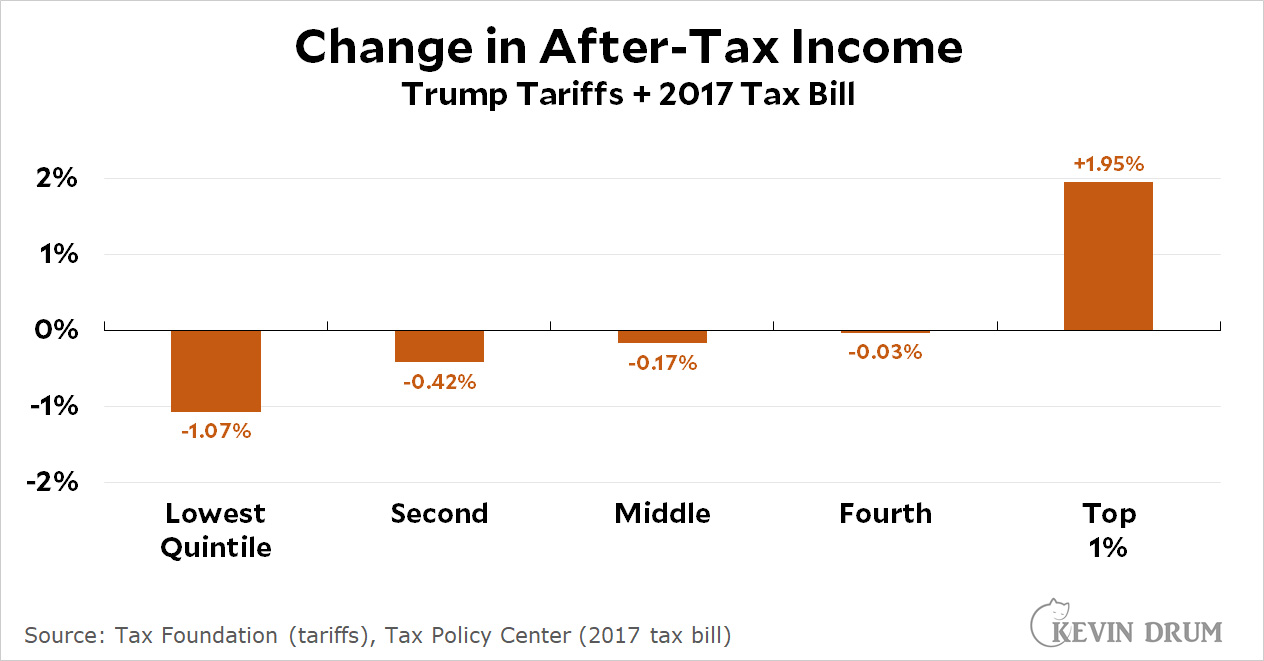
 Republicans always promise that their economic polices benefit the working and middle classes, but it's not true. During the Trump administration, Republicans passed a big tax bill and increased tariffs considerably. This benefited the top 1%, but reduced net income for everyone else.
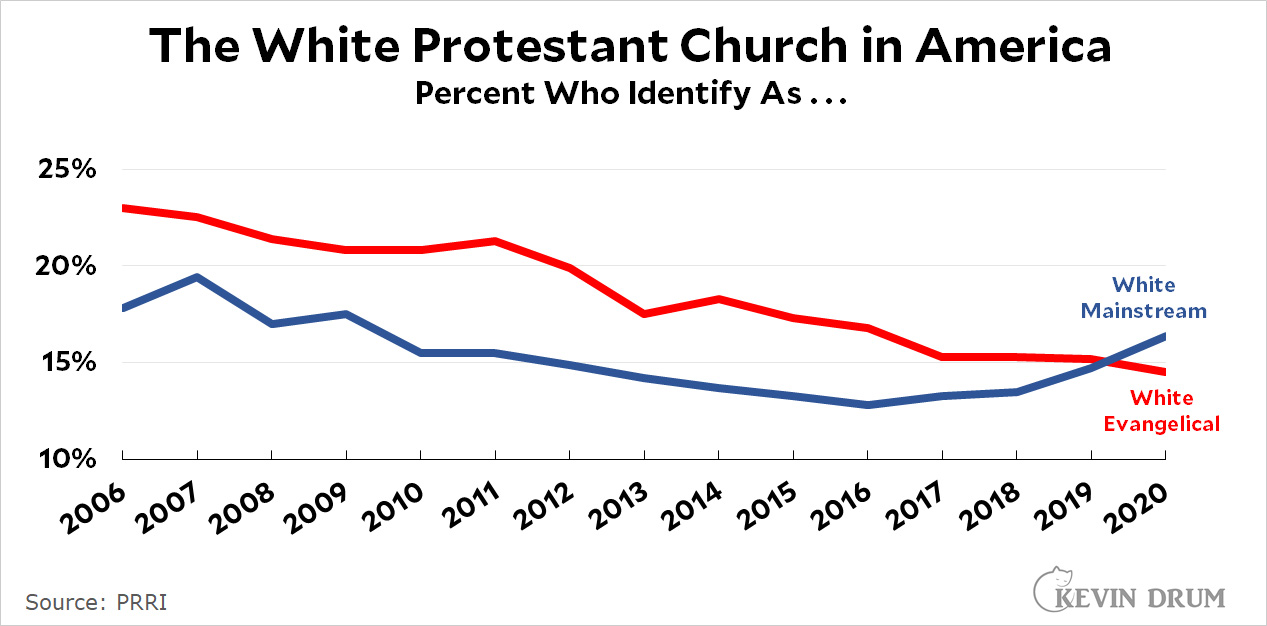
 The white evangelical church, which is the backbone of the Republican Party, has been losing members for a long time. In the past 15 years it's dropped from 23% of the country to 14%. Far from being the unstoppable political force that liberals think it is, it's losing influence steadily. This is why they embraced Donald Trump so enthusiastically: he was the first person in years who promised to bring back their glory days.
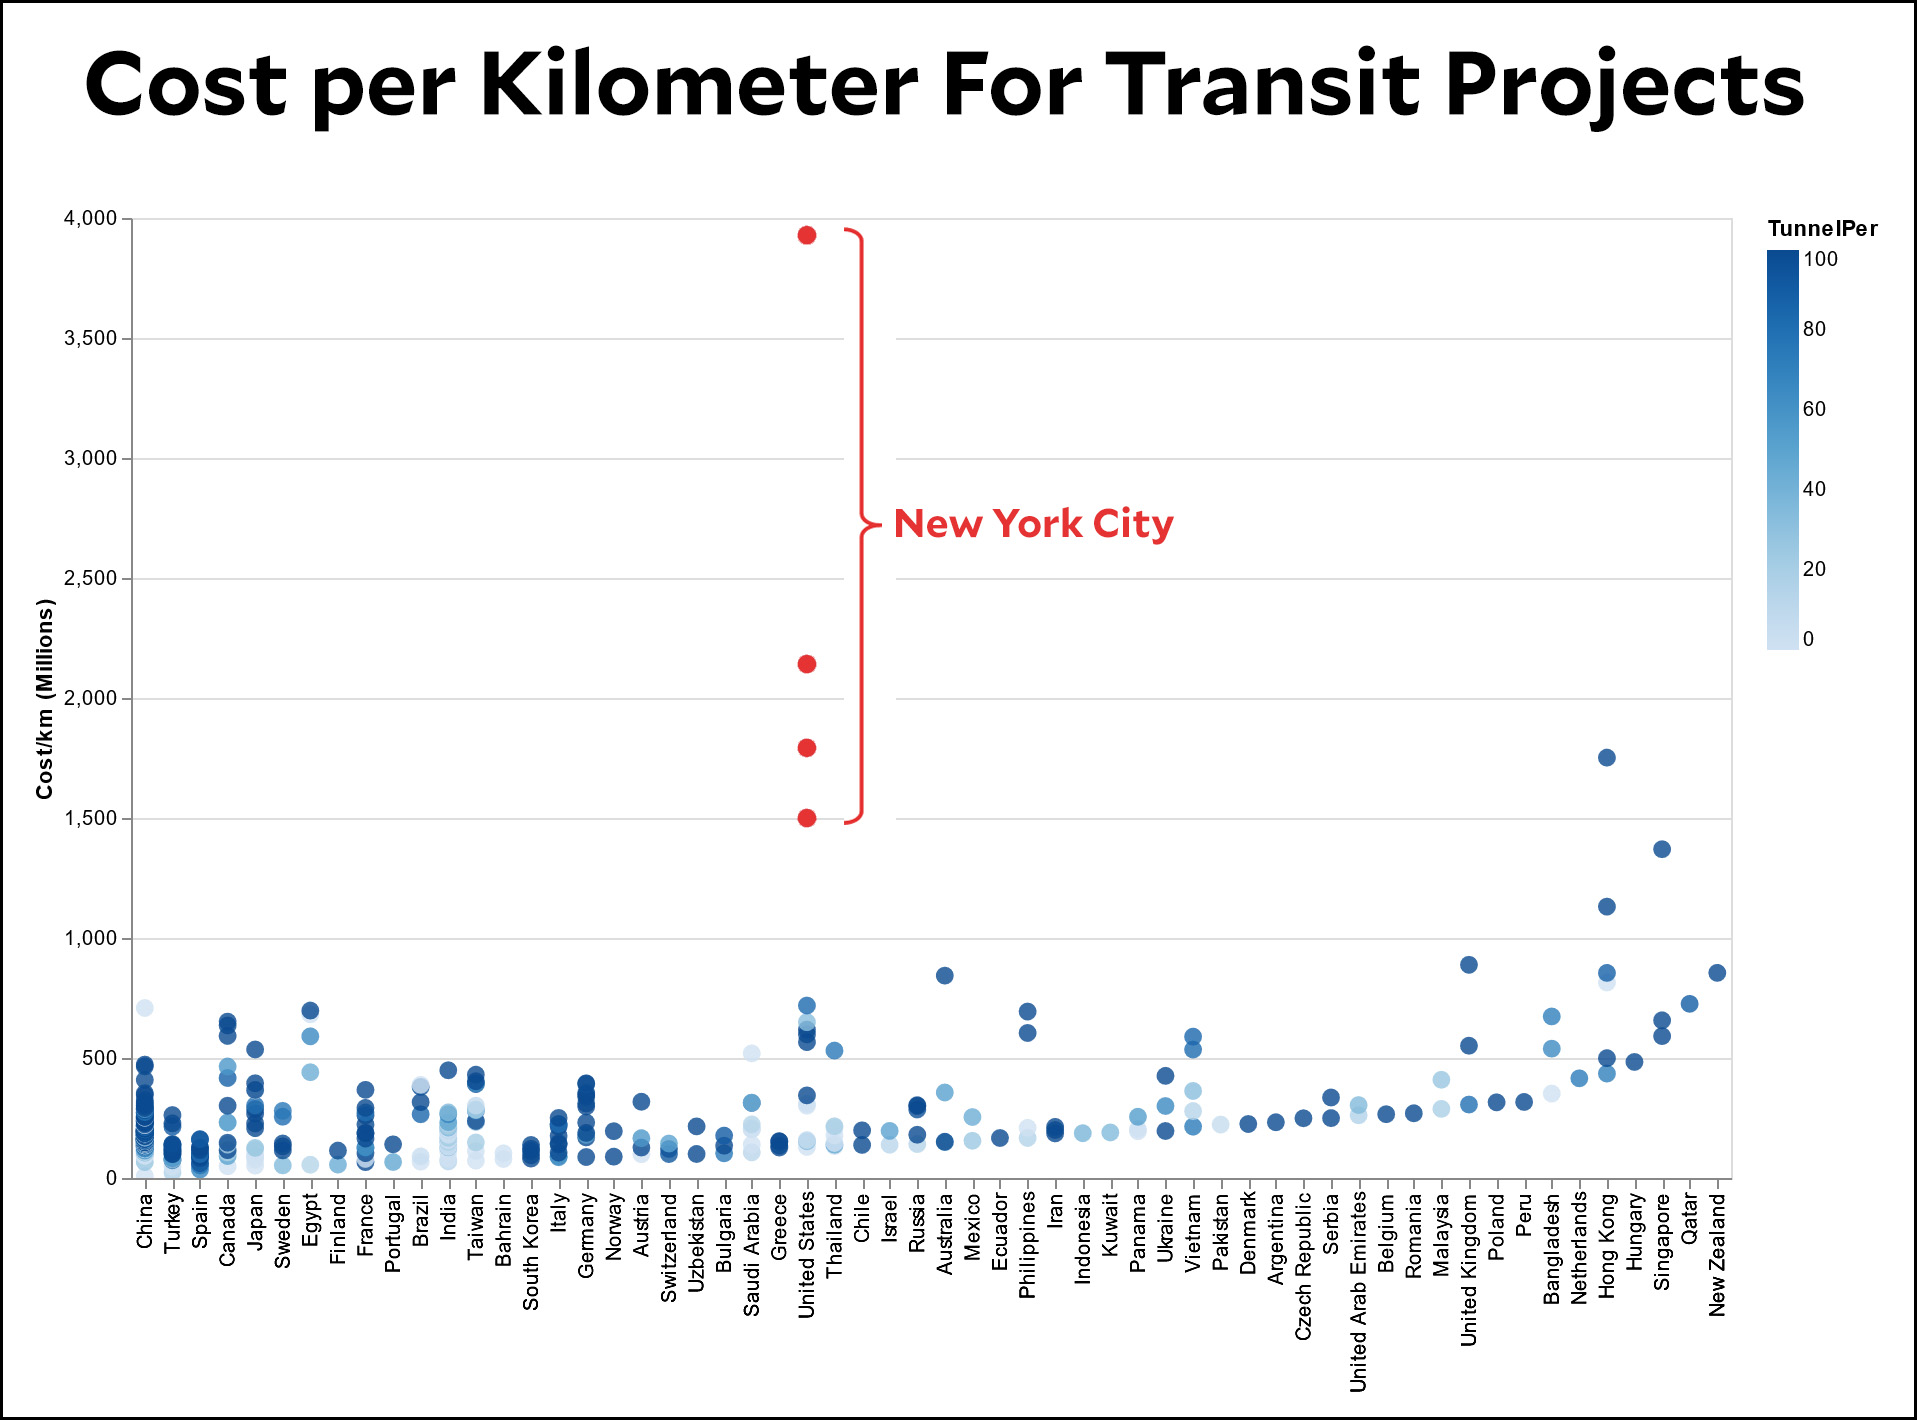
 It's conventional wisdom that transit projects in the US cost far more than in other countries. But as this chart shows, that isn't true. Transit projects in New York City are fabulously expensive, but in the rest of the country they're roughly on par with the rest of the world.
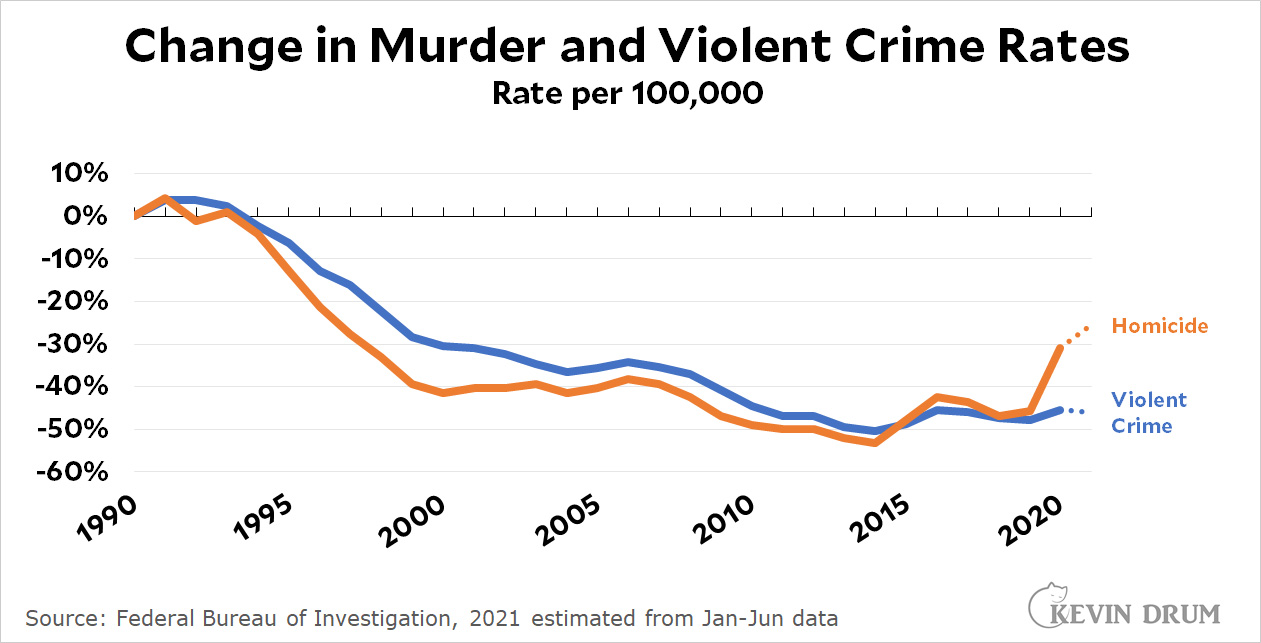
 This chart outlines a great mystery. Normally, murder and violent crime move in nearly identical directions, but in 2020 they suddenly diverged. Overall violent crime increased slightly, while homicide skyrocketed. Why? No one has an answer yet.
 This chart shows the rise in anti-democratic sentiment in the US. The main takeaway is that it happened only among Republicans, and only after Fox News started operation.
Fox News is a danger to the country, and not a small one. We ignore it at our peril.
I'm actually kind of shocked at the graph showing that mainline (Protestant?) church affiliation has now outpaced evangelical. That has got to be raising some eyebrows. For decades, conservative evangelicals have pointed their fingers at the mainline churches and their declining memberships and haw-haw'ed Nelson-style, claiming it was proof more people were drawn to their hardcore, Jesus-as-Punisher brand of Christianity than the kind of wussy, "love thy neighbor" nonsense being peddled by the Presbyterians or (God forbid) Unitarians.
I love the scene in "Succession" where the Unitarian Pierce clan — hosting the right wing Roy family — opts for Shakespeare instead of traditional Christian prayer for pre-dinner grace.
This post is one of the reasons I always read Kevin virtually every damn day! Thank you for putting this together for us. And Happy New Year!
Amen!
Thanks for the graphs and have a great 2022!
Two complaints:
1. I can't figure out what the graph about the cost of public transit is really demonstrating. The legend on the Y-axis is obscured by a stupid arrow symbol.
2. For crying out loud: The problem with means testing is that means tested programs due not benefit the middle class (this sis the purpose of means testing!), a bad thing IMHO but fair enough. Only don't then go ahead and scold anybody for not benefitting the middle class! Down with means testing!
On the higher murder count… how many extra killings is that? 5000? Can’t tell from the data.
https://lawandcrime.com/crime/michigan-man-allegedly-murdered-son-after-victim-taunted-why-dont-you-just-shoot-me-during-an-argument/
Are there a few extra murders now? I’m pretty sure I don’t care. Dumb ass drunks with guns kill people they know. It’s not a crime wave. It’s just dumb asses with guns and black teenagers. A few white ones too shooting up schools. And then there was that guy in Denver. It’s a fad.
It is amazing that NYC has such huge infrastructure costs yet does an amazing amount of infrastructure. Constant rebuilds of highways, bridges, a new subway line, a new East River tunnel for the LIRR, a new 3rd track for the LIRR main line just off the top of my head.
Infrastructure for NYC is an investment to keep financial-services companies from moving out to Westchester, Connecticut or New Jersey. Costs are very high, but so is the ROI.
If ROI were really that high, you'd think they'd plow more money into it. NYC's subway is a fucking joke compared to the metros of other Alpha cities. It's fallen badly behind London, and doesn't even belong in the same conversation as Seoul, Tokyo or Beijing.
Infrastructure in NYC is old (well over 100 in many cases), for one thing, which makes maintaining or upgrading it extremely complicated/expensive. The city's geology is also tough; tunneling new subways entails blasting through solid bedrock, under rivers, etc.. Lastly, and I say this as someone generally supportive of labor unions, the construction unions have negotiated contracts over the years that are pretty eye-popping in terms of pay and benefits. IIRC, public project workers in NYC make way, way more than even the best-paid workers in places like Japan and Germany, which pay their skilled tradespeople pretty well.
Japan may be sui generis for all I know, but I think the big difference between the US and the rest of the rich world on this score is that hyper neo-liberalism in the US means unionized public sector workers (or employees of government contractors) understandably feel a lot more embattled than their counterparts elsewhere. In many high income countries, unions have a real seat at the table, and are an important part of the The Establishment. In my view this fosters a more enlightened "greatest good for greatest number" mentality whereby efficient policies are practices are embraced (because they'll maximize the benefits to society as a whole).
In the US, under siege working people feel they've got to fight tooth and nail for their meager gains. Because they do. Which leads to an "I've got mine fuck the rest of you" dynamic.
I've described this in crude terms, yes, but I do think this really is at heart why NYC transit practices are so ludicrously, ruinously dear.
The differences are at least partly enforced by law - Germany’s Mitbestimmungsgesetz requires nearly equal representation on the supervisory boards of large companies. Workers therefore have considerable say in all corporate decision-making. US law and court decisions limit union bargaining to wages, benefits and work rules and conditions. So unions have incentives to press for the highest pay and benefits they can, because they know they will be totally shut out of decisions about outsourcing, plant closings, relocations, spin-offs and other actions that impact employment.
Nearly equal representation of shareholders and union workers …
Once again, the positive ratings for Instagram from teenagers probably have little meaning. How could using Instagram improve the financial stress of teenagers? This is is probably just a matter of checking positive boxes to justify their use of Instagram. Teenagers don't use Instagram because it really improves their lives in all these things, they use it because they crave social interactions. To really find out about the impact of Instagram would require very elaborate tests by experts. This survey is mainly a self-justification for Instagram, at least as the results turned out.
But Kevin is right that the body image response probably doesn't mean much either as the difference between it an the others is not great.
As I showed in a previous comment housing expense has really shot up recently
https://fred.stlouisfed.org/graph/?g=KmBI
And this includes the effect of record low interest rates on mortgages - and is for all cities. The rate for this component, 4.8% last month, is not enough to be driving the recent high overall inflation rate, although it will probably contribute more in the future. Dwelling price rises will work through to rent - the rise in house prices this year has probably has little effect as yet on rents. For some people who have to work in the affected cities housing price will be a problem.
Kevin thinks it's great that real incomes of working people have increased somewhat, but that ignores the huge increase in inequality. This plot shows how "production worker" wages have decreased relative to per-capita GDP
https://fred.stlouisfed.org/graph/?g=Kqxx
And this is something that has been going on only since the 60's. Before that wages (index from the Economic History project) generally did keep up with GDP.
http://www.skeptometrics.org/WageIndex.png
Yes, some has trickled down, but the great majority of economic growth over the last 50+ years has gone to upper incomes, and most of that to the very top.
By the way, the ratio in the first graph increases in time of recessions because of decrease in GDP. Nominal wages are sticky: employers cut workers, not wages, in bad times. The sharp jump in 2020 is an extreme example of this, although average nominal wages also increased because the lowest-earning workers were disproportionately laid off.
Good points