
I'll confess that even I have a bit of inflation fatigue. But how about one more round? Today the BLS presents us with the latest figures for the Producer Price Index, which is basically wholesale prices. Here it is through June:
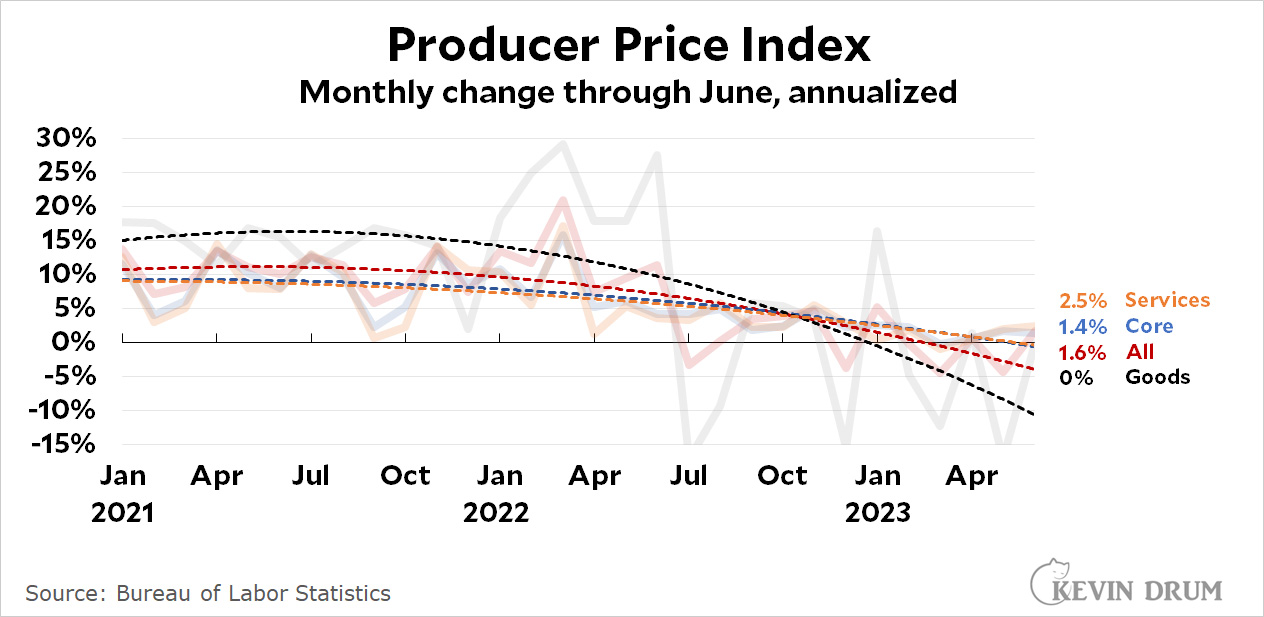 Although the overall PPI jumped a bit in June, it has been absolutely flat over the past year. It shows zero inflation in producer prices since last June. (Goods are down 4.4% over the past year. Services are up 2.3%.)
Since wholesale prices eventually feed into consumer prices, the plunge in the PPI has been leading the way for the drop in the CPI. It appears to still be on its way down, so it will almost certainly push even further declines in the CPI over the rest of the year.
Weird how today, the emphasis is on the year-over-year number, when yesterday, we were admonished against even asking about the year-over-year number.
Kevin, I love you, but you're just too obviously pursuing a narrative, facts be damned. Your internal consistency is shot. Please take a break from this topic.
I don't know what Kevin means by "the overall PPI jumped a bit in June". The index value was actually slightly lower in June over May, giving -0.5% month/month inflation (annualized) and the year/year value continued downward. Aside from that everything that Kevin says is correct - the PPI is clearly foreshadowing lower headline inflation (as I have said before in comments). Since June 2022 PPI inflation has been near zero and CPI inflation has been 3%. June/July 2022 was a definite turning point.
If you want to visualize what is happening with these measures (and don't like Kevin's curves), go to the FRED site:
https://fred.stlouisfed.org/series/PPIACO
You can edit the graph to show whatever you want.
It looks like you linked to the index for commodities. I'm not an expert, but I believe this is a subset of full PPI.
The headline index for PPI seems to be "final demand," which increased slightly in June. Again, this isn't an area of expertise for me, but that seems to be the headline index as mentioned in the BLS report:
https://www.bls.gov/web/ppi/ppi_dr.pdf
I'm not sure whether Kevin was using seasonally adjusted or not seasonally adjusted numbers, but they both increased a bit in June:
https://fred.stlouisfed.org/series/PPIFIS
https://fred.stlouisfed.org/series/PPIFID
My point was about how he was describing them, though, not whether his data was correct. When the MoM data supports his "inflation is over" message and YoY doesn't, he cites MoM and tells us YoY is not useful. When YoY supports his "inflation is over" message and MoM doesn't (the very next day), he tells us to look at the YoY numbers.
I don't know how anyone can defend that.
Working part-time, I bring in more than $13,400 every month. I made the decision to research it after hearing a lot of people talk about how much money they could make online. All of it was real, and it completely 10 altered my life. You can read this article for
additional information…. https://needpeopleNYC.blogspot.com
The inflation challenge is better shown in CPCEPI (Core Personal Consumption Expenditure Price Index). It is my understanding the Fed values the aforementioned index.
https://tradingeconomics.com/united-states/core-pce-price-index
The beatings will continue until morale improves, or until Republicans gain control of everything again.
I don't really have anything to say about this post, but I am getting kind of sick of the parabolas. They strike me as lazy at best, but are potentially misleading.
When I look at the underlying data, noisy though it is, I spy patterns that do not match the parabolas.