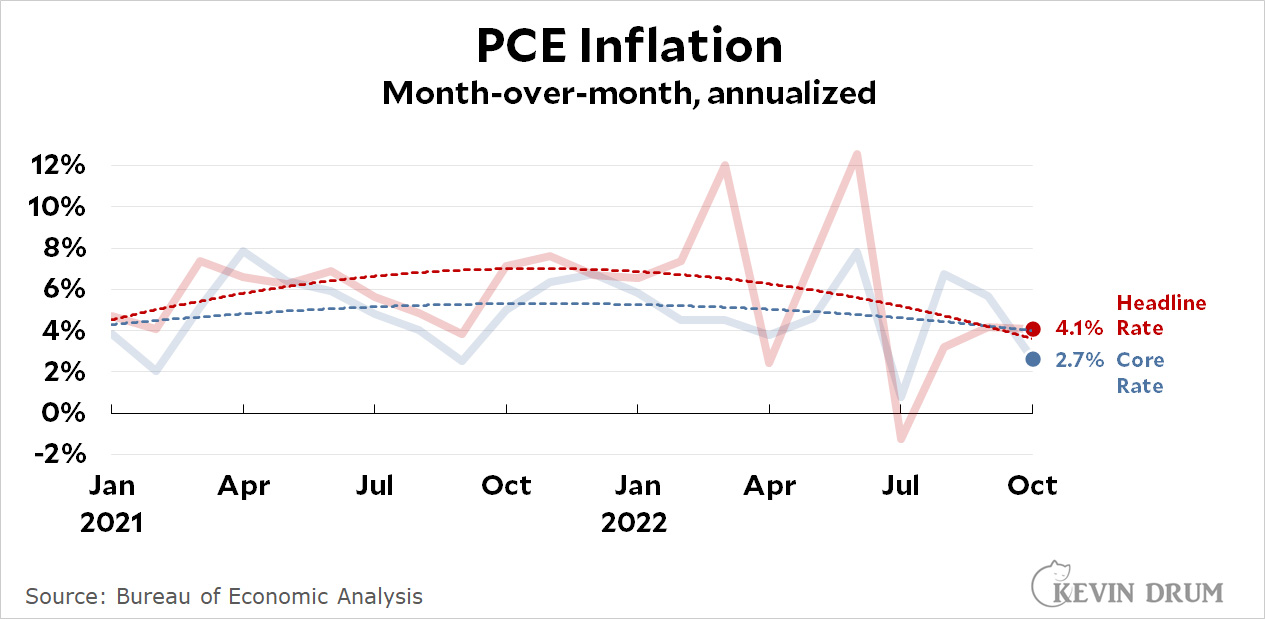
The core PCE inflation rate plummeted again in October:
 Core PCE checked in at 2.7% in October and the headline rate came in at 4.1%. Both are lower than last month, but core in particular has now had two consecutive huge declines.
I am, as usual, highlighting the core rate (inflation excluding food and energy) because that's the figure that allegedly drives the Fed's decisionmaking. It matches a big drop in core inflation reported for the euro area yesterday.
However, unlike the Fed I focus on the month-over-month figure since it shows us what's happening to inflation right now, but then I draw a trendline over the curve in order to reduce the noise. This makes it a better indicator of actual inflationary pressure in the economy. The trend core rate in October was down to 4.0% and the trend headline rate was down to 3.7%.
NOTE: The more normally reported year-over year figures, which you'll see in most newspaper headlines, came in at 6.0% for headline inflation (i.e., all items) and 5.0% for core inflation (all items minus food and energy. But after all this time we know better than to rely on annual changes that already have 11 months of data baked in. Right? It's better to look at monthly changes that show how inflation is doing right now, and then draw a trendline to see the longer-term change.)

My cousin could truly receive money in their spare time on their laptop. their best friend had been doing this 4 only about 12 months and by now cleared the debt. in their mini mansion and bought a great Car.
That is what we do.. https://earningblue.blogspot.com/
"NOTE: The more normally reported year-over year figures, which you'll see in most newspaper headlines, came in at 6.0% for headline inflation (i.e., all items) and 5.0% for core inflation (all items minus food and energy. But after all this time we know better than to rely on annual changes that already have 11 months of data baked in. " In precise mathematical terms, the year over year inflation measure is a 12 sample moving average and the correct time point is the midtpoint of the window. I.e. what is referred to as the november year over year inflation is a measure of where inflation was in May.
Is that the rate you used when inflation adjusting gasoline prices?