Last weekend I wrote a long, chart-laden post that summarized the evidence about housing in the US. I received some criticism that seemed reasonable, so I figured I'd address them here.
Anne Paulson suggested that I shouldn't compare housing growth to population growth because housing is an adult thing. If a family has more children, it will still occupy a single housing unit. Here is adult population growth vs. housing unit growth:¹
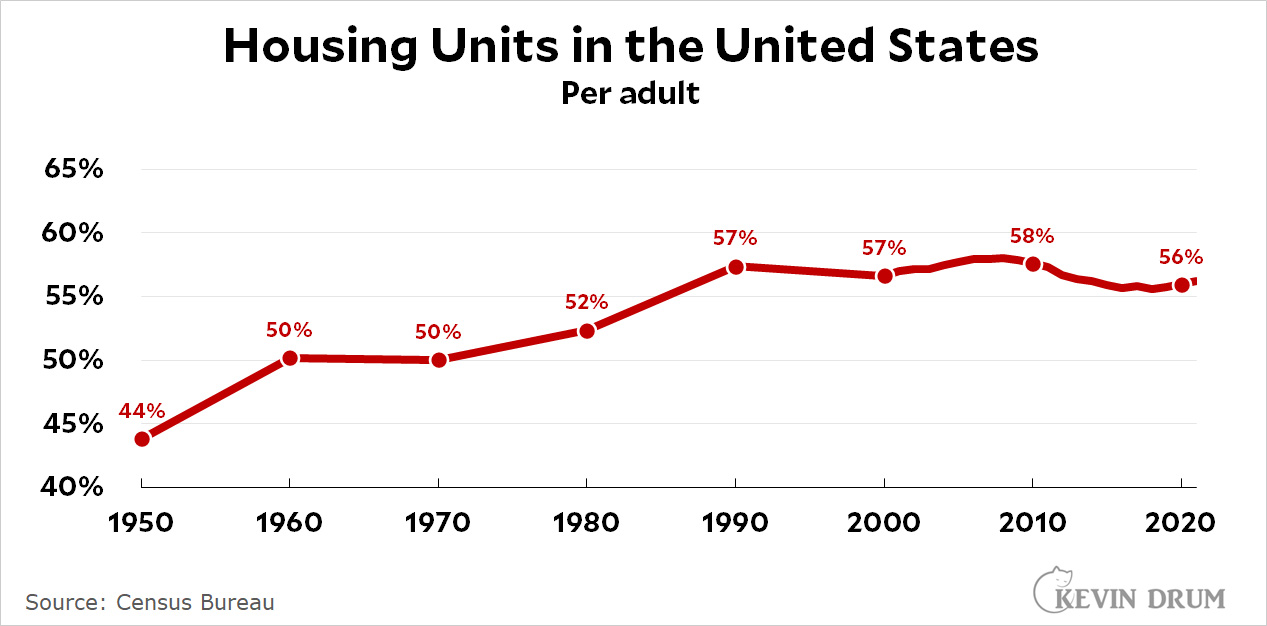 I charted this over a long period in order to provide some context. After World War II there was a huge shortage of housing as soldiers returned home and got married. It was a major political issue that produced housing developments like Levittown; the growth of suburbs and interstate highways; and a huge increase in housing projects for low-income families.
The result was strong growth in housing units, followed by another strong growth in the '70s and '80s as the baby boomer generation grew up and moved out. More recently, growth slowed down in the aughts and flattened out to nearly nothing in the 2010s. In 2021 the number of adults barely budged, ending at 252.6 million. The number of housing units ended up at 142 million, for a ratio of 56.2% (compared to 56.6% in 2000).
You can draw your own conclusions from this. On the one hand, housing growth has slowed down considerably. On the other hand, this was largely because population growth also slowed down considerably. On a countrywide basis, we have the same number of housing units available per adult as we did 20 years ago.
A second comment came from Kevin Erdmann, who criticized my use of housing inflation vs. overall inflation. As it turns out, "housing" includes furniture and other things that go into the total cost of living. "Shelter" excludes those, but includes hotels and dormitories. The best measure is rent, which the BLS calculates directly for renters and as owners' equivalent rent for homeowners. I weighted the two together and produced this chart:
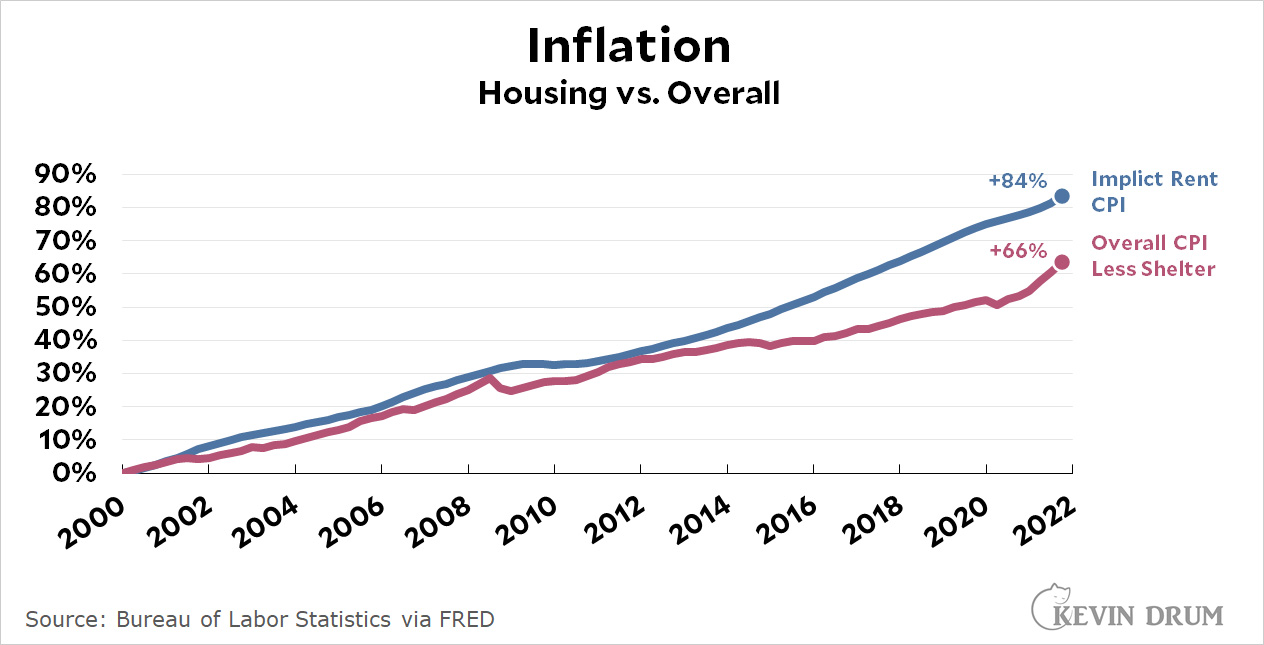 This shows a larger increase in rent CPI than my previous chart. In particular, rent has grown 11% more than overall CPI since 2000 (184 ÷ 166 = +11%). This suggests a tightening of the housing market—the rental market in particular—but note that it's a measure of inflation, not prices directly. I also included a chart that directly measures home prices, including the effect of interest rates, and it shows a decline in home price. Another chart shows average gross rents, and it suggests very little change at all.
In any case, these are easy charts to correct, so why did it take me so long to produce them? That's a different, and more complex story, and you might just want to stop here and skip the explanation. But if you want the read the whole thing, keep going.
Kevin Erdmann also had a longer and very different criticism of my piece. It took me quite a while to plow through it, and that, among other things, explains why this post is showing up on Sunday instead of last Monday.
To begin with, Erdmann has written a couple of books making the case that there was never a housing boom. There are quite a few economists who now agree with him, so this isn't a wildly contrarian take. And if you'll take a look at the top chart, which compares housing units to families, you'll see one bit of evidence that he's right: The line from 2000-2010 is pretty smooth, with only a small upward rise. This may not suggest a housing shortage, but it doesn't suggest a housing boom either.
However, Erdmann believes that we do have a housing shortage now and have had one for quite a while. What happened in the early aughts was not a housing boom, but a credit boom. Banks lent freely, but many cities refused to allow enough home and apartment construction to match the level of credit available. As a result, the price of housing of all types—both low-tier and high-tier—was bid up.
Now, obviously anyone who thinks we already had a housing shortage, and then failed to have a housing boom, is likely to disagree with me about whether we're currently suffering from a housing shortage. However, Erdmann's belief is, in the end, not so different from mine: Overall, there's no housing shortage, but there is a housing shortage in hot urban areas that people want to move to:
This is a new era in American housing....The norm until recent decades was for metro areas to grow when they are economically ascendant and to stop growing when they struggle. During the early and mid-20th century, the Detroit metro population grew by nearly 3% annually. Back then there weren't individual cities with incomes far above the norm, like there are today. Over the early 20th century, people moved to opportunity and regional incomes were converging as a result. Today they can't, so some metro area incomes are skyrocketing away from the norm. This is new!

As the chart shows, the highest rents and home prices are all in California—and unless I miss my guess, the blue circles representing 2007 are the same four cities. In other words, this is the standard complaint: House prices in California are rising too much for anyone to afford moving there. But that's where people want to go! So they keep trying, and this increases house prices (and rent) even more.
More interestingly, Erdmann makes the case that "credit suppression" is making hot urban areas especially unaffordable for low-income workers. This is because banks, which were lending to anyone before 2008, have learned their lesson and are now less likely to offer loans to working class families. Before 2008, prices for all types of neighborhoods went up and down at about the same rate. After 2008, low-tier housing collapsed because banks refused to lend into poor areas. For example:
 I can't guarantee that I fully understand Erdmann's argument, but I guess I'd distill it into two points:
- California has a housing shortage. The rest of the country not so much.
- Thanks to the subprime crisis, working class families have been significantly shut out of the credit market. Richer families have fully recovered from the housing bust.
I haven't read Erdmann's books, so I don't have the full story on why he thinks we have a housing shortage. However, you can read a condensed version here.
POSTSCRIPT: I'm going to stop here because I'm just confused by too many of Erdmann's arguments. For example, he says that if rent inflation is high, but people are spending the same amount every year on rent, then they're spending less in real terms on rent. That's true. But I didn't say that people are spending the same amount on rent. I said they're spending the same percentage of their income on rent, which is a growing number. Maybe Erdmann has an explanation for this?
¹The number of families is here, Table FM-1. The number of housing units from 1950-2000 is here. The number of family units from 2000-2021 is here.