Skip to content

This is off the beaten path, but this tweet reminded me of something:

The Myers-Briggs personality test gets a lot of abuse, and mostly for good reason. It's a mish-mash of stuff based loosely on Jungian archetypes that are no longer taken seriously, and it has little connection to modern views of personality traits. It's never been tested for validity or reliability, and its 16 different personality types (or "Type Indicators," thus MBTI as the formal name of the test) are probably kind of meaningless.

But that doesn't make it useless. It's fun and easy to take, and if you administer it to a large group it teaches a valuable lesson: people are different. That may seem pretty obvious, but it's surprisingly less obvious than you'd think. If you watch group interactions—especially contentious ones—it's clear that lots of people operate with no real understanding that other people aren't just being stubborn about recognizing "obvious" truths; they genuinely have different ways of viewing the world.

One of the things the MBTI does is devote some time to explaining (a) how different personality types are good at different things, and (b) how you should interact with different personality types. Even if the specific advice is questionable, the simple idea that you should acknowledge differences in people and act accordingly is fairly valuable.

POSTSCRIPT: Of course you want to know what personality type I am. I'm an INTJ. Is that meaningless? Well, the MBTI is basically a set of questions that asks things about your personality. Do you like being around other people? Do you like to work through problems logically? Are you empathetic toward other people?

In a nutshell (to take just one personality trait), it asks in various ways if you're introverted or extroverted. If you mostly answer extroverted, then it says you're extroverted. Amazing! This is not rocket science, and it's likely to be at least reasonably accurate. So even on this measure, I doubt the MBTI is all that bad. I mean, that INTJ description sounds a lot like me, doesn't it?

Here's a chart someone linked to on Twitter yesterday. It shows housing prices in various cities:

The basic idea here is that if you put up more regulatory barriers to building new housing, the price of housing goes up. I don't really doubt this. How could it be otherwise, in fact?

That said, take a look at Los Angeles and Riverside. Both are in Southern California. Both have almost exactly the same level of regulation. And yet housing in Los Angeles costs nearly twice as much as it does in Riverside. That's a huge difference.

What accounts for it? The answer is hardly rocket science: LA is a more desirable location than Riverside, which is hot, culturally desolate, and mostly just an endless sea of suburban houses.

In other words, desirable places have higher housing prices regardless of regulatory issues. Regulation can certainly make things worse, but I think it's pretty clearly a secondary consideration.

I'm not quite sure what set me off this time, but something I read prompted me to make a couple of charts illustrating US economic performance compared to our large peer countries in Europe. Here is GDP since the start of the pandemic:

Thanks to the $3 trillion in relief spending that was passed almost immediately after the economy started to plummet in response to COVID-19, our GDP fell only about 10% during the first stage of the pandemic. This compares to nearly 20% in Italy, France, and the UK (Germany's economy responded more like ours). Because of this we had an easier time rebounding.

We passed another $1 trillion in relief in Q4 of 2020, which helped boost performance as we were climbing out of the COVID hole, and then another $1.9 trillion in Q1 of 2021, which helped boost performance further.

The end result of all this is that we suffered less during the early stages of the pandemic and recovered more strongly in the later stages. That's good!

But wait. The final $1.9 trillion that Democrats passed in 2021 also produced surging inflation. This is probably true, but take a look at how we compare:

This is month-over-month inflation converted into annual rates. As I've said many times before, this produces noisy raw data (shown by the pale thin lines) and is of little use. What you need to look at are the trendlines, which are the heavy dashed lines.

As you can see, our inflation rate was indeed higher than other countries in 2021. But by the end of the year it was starting to decline as the Biden stimulus spending finished working its way through the system. Conversely, inflation in large European countries is still increasing. (UK inflation is trending down at the moment, but every forecast suggests it's going to skyrocket going into next year.)

A couple of notes about all this. First, I've used core inflation so that Europe doesn't look unfairly bad thanks to high energy prices caused by the Ukraine war. Second, for the US I've used an approximation of HICP, which is the EU method of measuring inflation. This ensures that the comparison is apples to apples. US performance looks better if you use core PCE instead.

Bottom line: our huge spending produced strong economic growth that kept the economy from shrinking too much and forestalled a tremendous amount of human suffering. At the same time, the inflation it produced was higher than Europe's in 2021 but is now falling. A year from now, no matter how you measure it, the American economy is going to look like a major success story compared to our peer countries.

Congratulations to the new and improved Trojan football team, which crushed the doughty Rice Owls on Saturday, 66-14. How did we do it coming off a 4-8 record last year? Easy! In the off season we bought ourselves a new coach, a new quarterback, and a few miscellaneous running backs and wide receivers via the transfer portal and promises of NIL riches. For starters, a new collective of rich donors called Student Body Right is raising money to provide every football player with “the equivalent of a base salary”—though only if they complete the "required charitable work." Wink, wink. Then there's the additional $15 million per year that USC itself is raising. And for finishers, there's all the money the actual NIL licensees will cough up in individual deals. USC football players should be rolling in dough before long.

Go Trojans!

December 19, 2021 — Los Angeles, California

Bob Somerby was not happy with President Biden's speech last week:

Biden defined a group of Others without taking care to explain exactly who he was talking about. He kept describing the views and ambitions of "MAGA Republicans"—but who did he mean by that?

Was he talking about Republican leadership cadres? Was he talking about the Republican rank and file? Biden made little attempt to define who he was talking about.

Personally, I thought Biden's speech was fine. But I agree with Bob that it would have been better if Biden had focused more strongly on Republican leaders, not the rank-and-file.

Politically, this is useful because there's not much point in insulting a large group of voters. That gets you nowhere.

Factually, it's useful because it's true. The villains in this story are Republican leaders like Newt Gingrich and Donald Trump. The institutions at fault are Fox News, the Heritage Foundation, and so forth. The pundits at fault are Tucker Carlson, Rush Limbaugh and a cast of thousands of others. Then add to that all the less extreme conservative leaders who don't spread the worst of the twaddle but tolerate it from others because they're too cowardly to speak out against it.

This is where the hatred originates. I won't say that the Republican rank-and-file is made up entirely of good people—it's some and some, just like any other large group of humans—but they aren't fundamentally at fault for any of this. They're just following the lead of those with big megaphones and lots of power. The rest of us do much the same, and we're just lucky that our leaders aren't as repellent.

I headed out to a local semi-darkish spot in Trabuco Canyon last night, mostly to test my autoguiding software. Sadly, it continued not to work. I'm not sure what I'm doing wrong.

The sky in Trabuco Canyon is not great (it's still Orange County, which is swamped by the Los Angeles light dome) but it's better than my backyard. So I went ahead and took a couple of pictures as long as I was there. One of them didn't work at all and probably needs a darker sky and longer exposure times. The other is the Andromeda Galaxy. This was a quickie image, and not all that great. Still, progress is being made!

The small object at the top left is a dwarf elliptical galaxy (M110) that orbits Andromeda. The bright object at center right is a compact elliptical galaxy (M32) that's yet another satellite of Andromeda.

September 4, 2022 — Andromeda Galaxy (M31)

According to a new Wall Street Journal poll, the public has become more supportive of abortion since the Supreme Court issued its Dobbs ruling. Some groups have become way more supportive:

Abortion is a far more motivating issue for Democrats than Republicans. More than half of all voters said the Dobbs ruling made it more likely they'd vote in November, and of that, 77% were Democrats compared to only 8% who were Republicans.

Democrats were also more trusted to handle abortion policy, 48% to 27%. And big majorities opposed most bans on abortion:

  • 62% opposed an abortion ban at 6 weeks of pregnancy that only included an exception for the health of the mother
  • 57% opposed a ban at 15 weeks with an exception only for the health of the mother
  • 77% opposed banning women who live in states where abortion is illegal from traveling to other states to get an abortion.
  • 81% were against banning all abortions.

If Democrats can keep up this level of energy for another couple of months, it could make a serious dent in the current Republican lead. Just remember: The midterms aren't over until the pissed-off women sing.

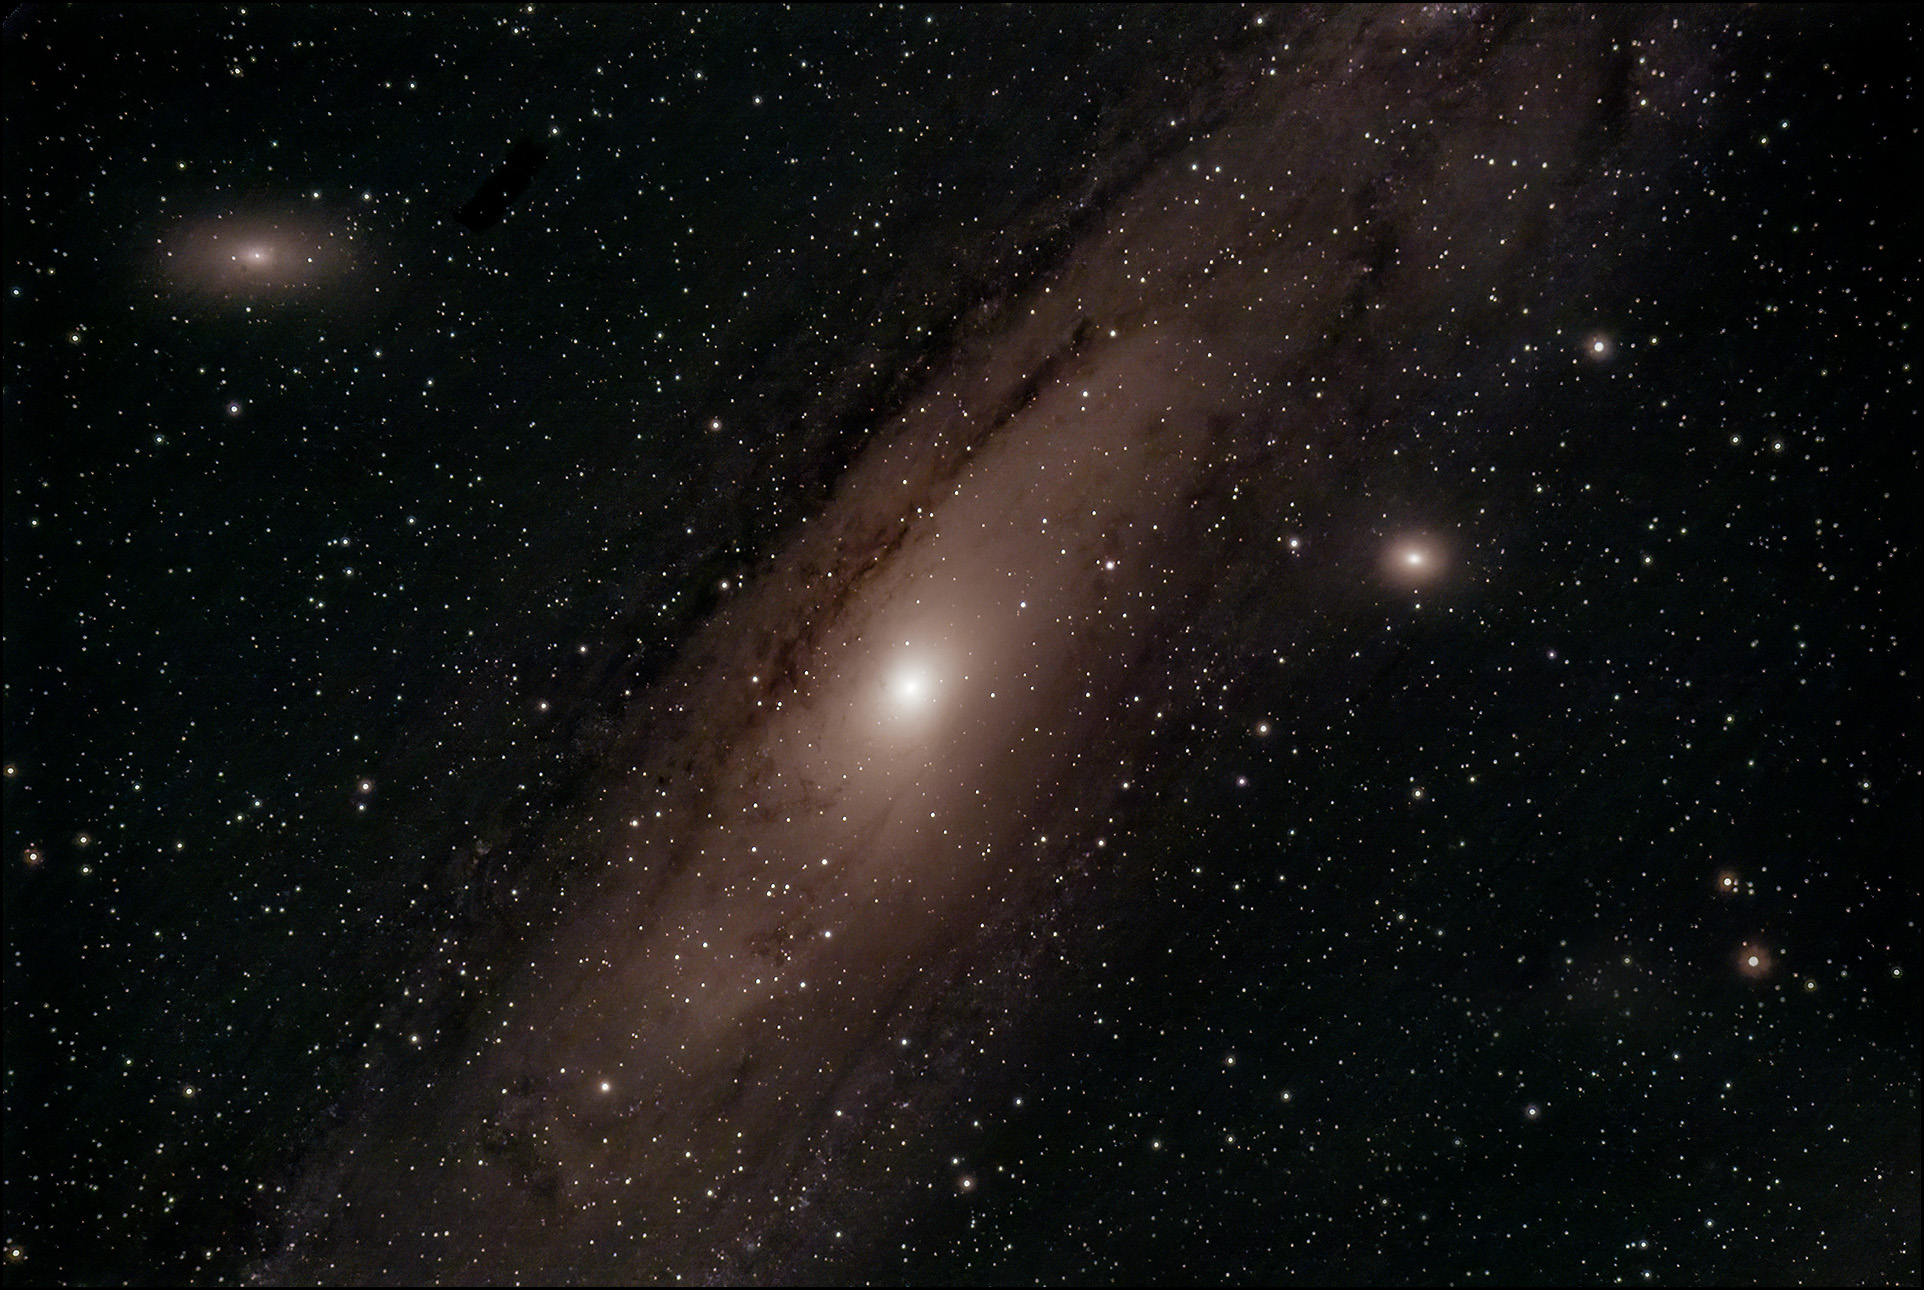
A few days ago I promised to tell you all about my new astrophotography setup, and today's the day. Let's start with a picture:

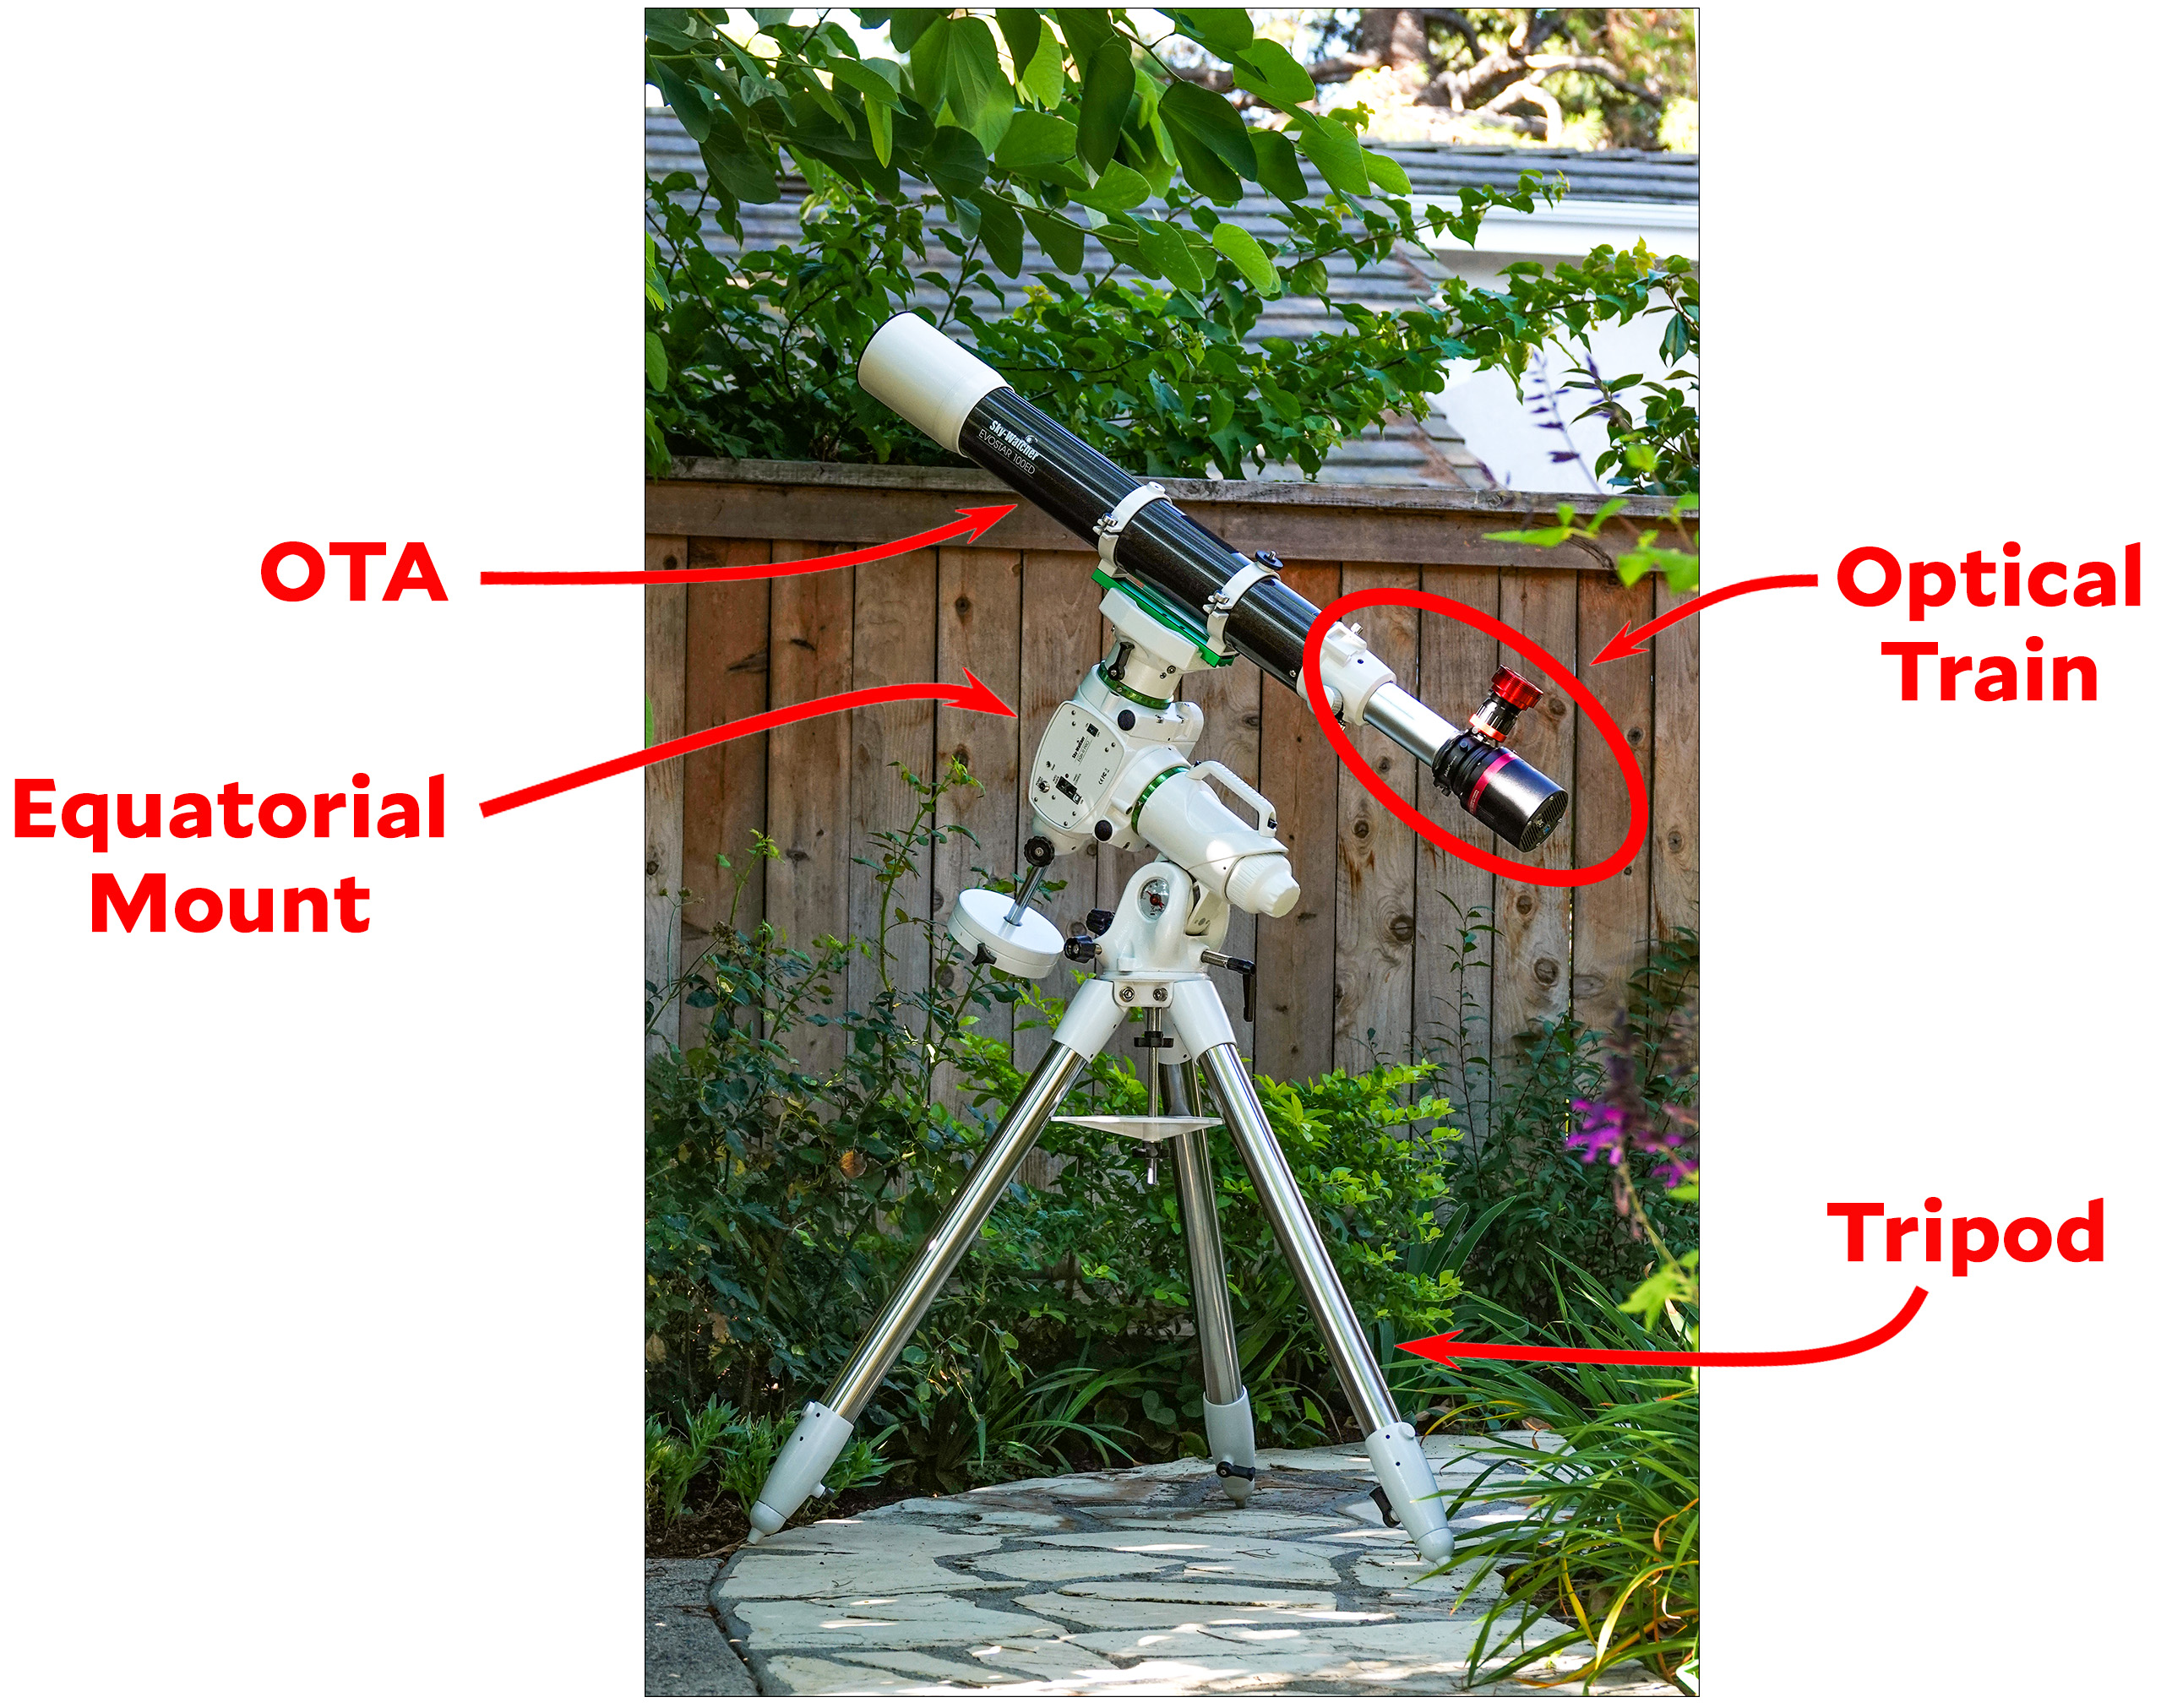
The four main parts are:

OTA stands for Optical Tube Assembly—more commonly known as a "telescope." Mine is a Skywatcher ED100 apochromatic refractor. ED means "extra-low dispersion" and refers to a particularly high grade of optical glass. 100 is the diameter of the objective lens in millimeters. In the US, this size of telescope is usually referred to as a four-inch. Apochromatic is a lens design that's become very affordable in recent years. It focuses all three colors at precisely the same point and, in combination with the ED glass, produces unusually low chromatic aberration. (Mine is a doublet APO, which means the lens assembly contains two lenses. More expensive models are triplet APOs.) Finally, refractor just means that the telescope uses lenses rather than a mirror.

The focal length of the telescope is 900mm, which is a little longer than most people recommend for a beginner, but my goal is to take pictures of DSOs, or Deep Sky Objects, such as nebulae and galaxies, and for that I wanted a little more reach in the optics. The downside of this is that it has an aperture of f/9, which is fairly slow. This means that I have to take longer exposures than I would if I had a faster telescope.

The equatorial mount is a motor drive that moves the telescope in the opposite direction of the earth's rotation. This keeps objects in the same place even during long exposures of a minute or more.

My mount is a Skywatcher EQ6-R. This is a very nice mount, and it's more than I wanted. However, the EQ5 was out of stock everywhere, so I went ahead and got the EQ6 instead. I don't mind the extra cost too much, since I may very well need the better mount in the future, but damn, this thing is heavy. I have to break down and put together the entire setup whenever I go somewhere, and placing the mount on top of the tripod is the only part that's really a pain in the ass.

The optical train contains all the stuff that allows me to take pictures. More on that later.

The tripod is just a tripod. It's a big, super stable tripod, but there's nothing more to it.

So that's basically the whole setup. When I set it up for a shooting session, it goes like this:

  1. Set up tripod facing more-or-less north. If necessary, level the tripod.
  2. Place mount on tripod. Use a compass to get it closer to pointing north. Later on, software will be used to get the mount pointed precisely to the North Celestial Pole (NCP).
  3. Attach OTA to mount. This is done via a dovetail mounting bracket.
  4. Attach the optical train.
  5. Attach power cables to my power supply and USB cables to my laptop.
  6. Done!

Next up, here's a close-up of the optical train:

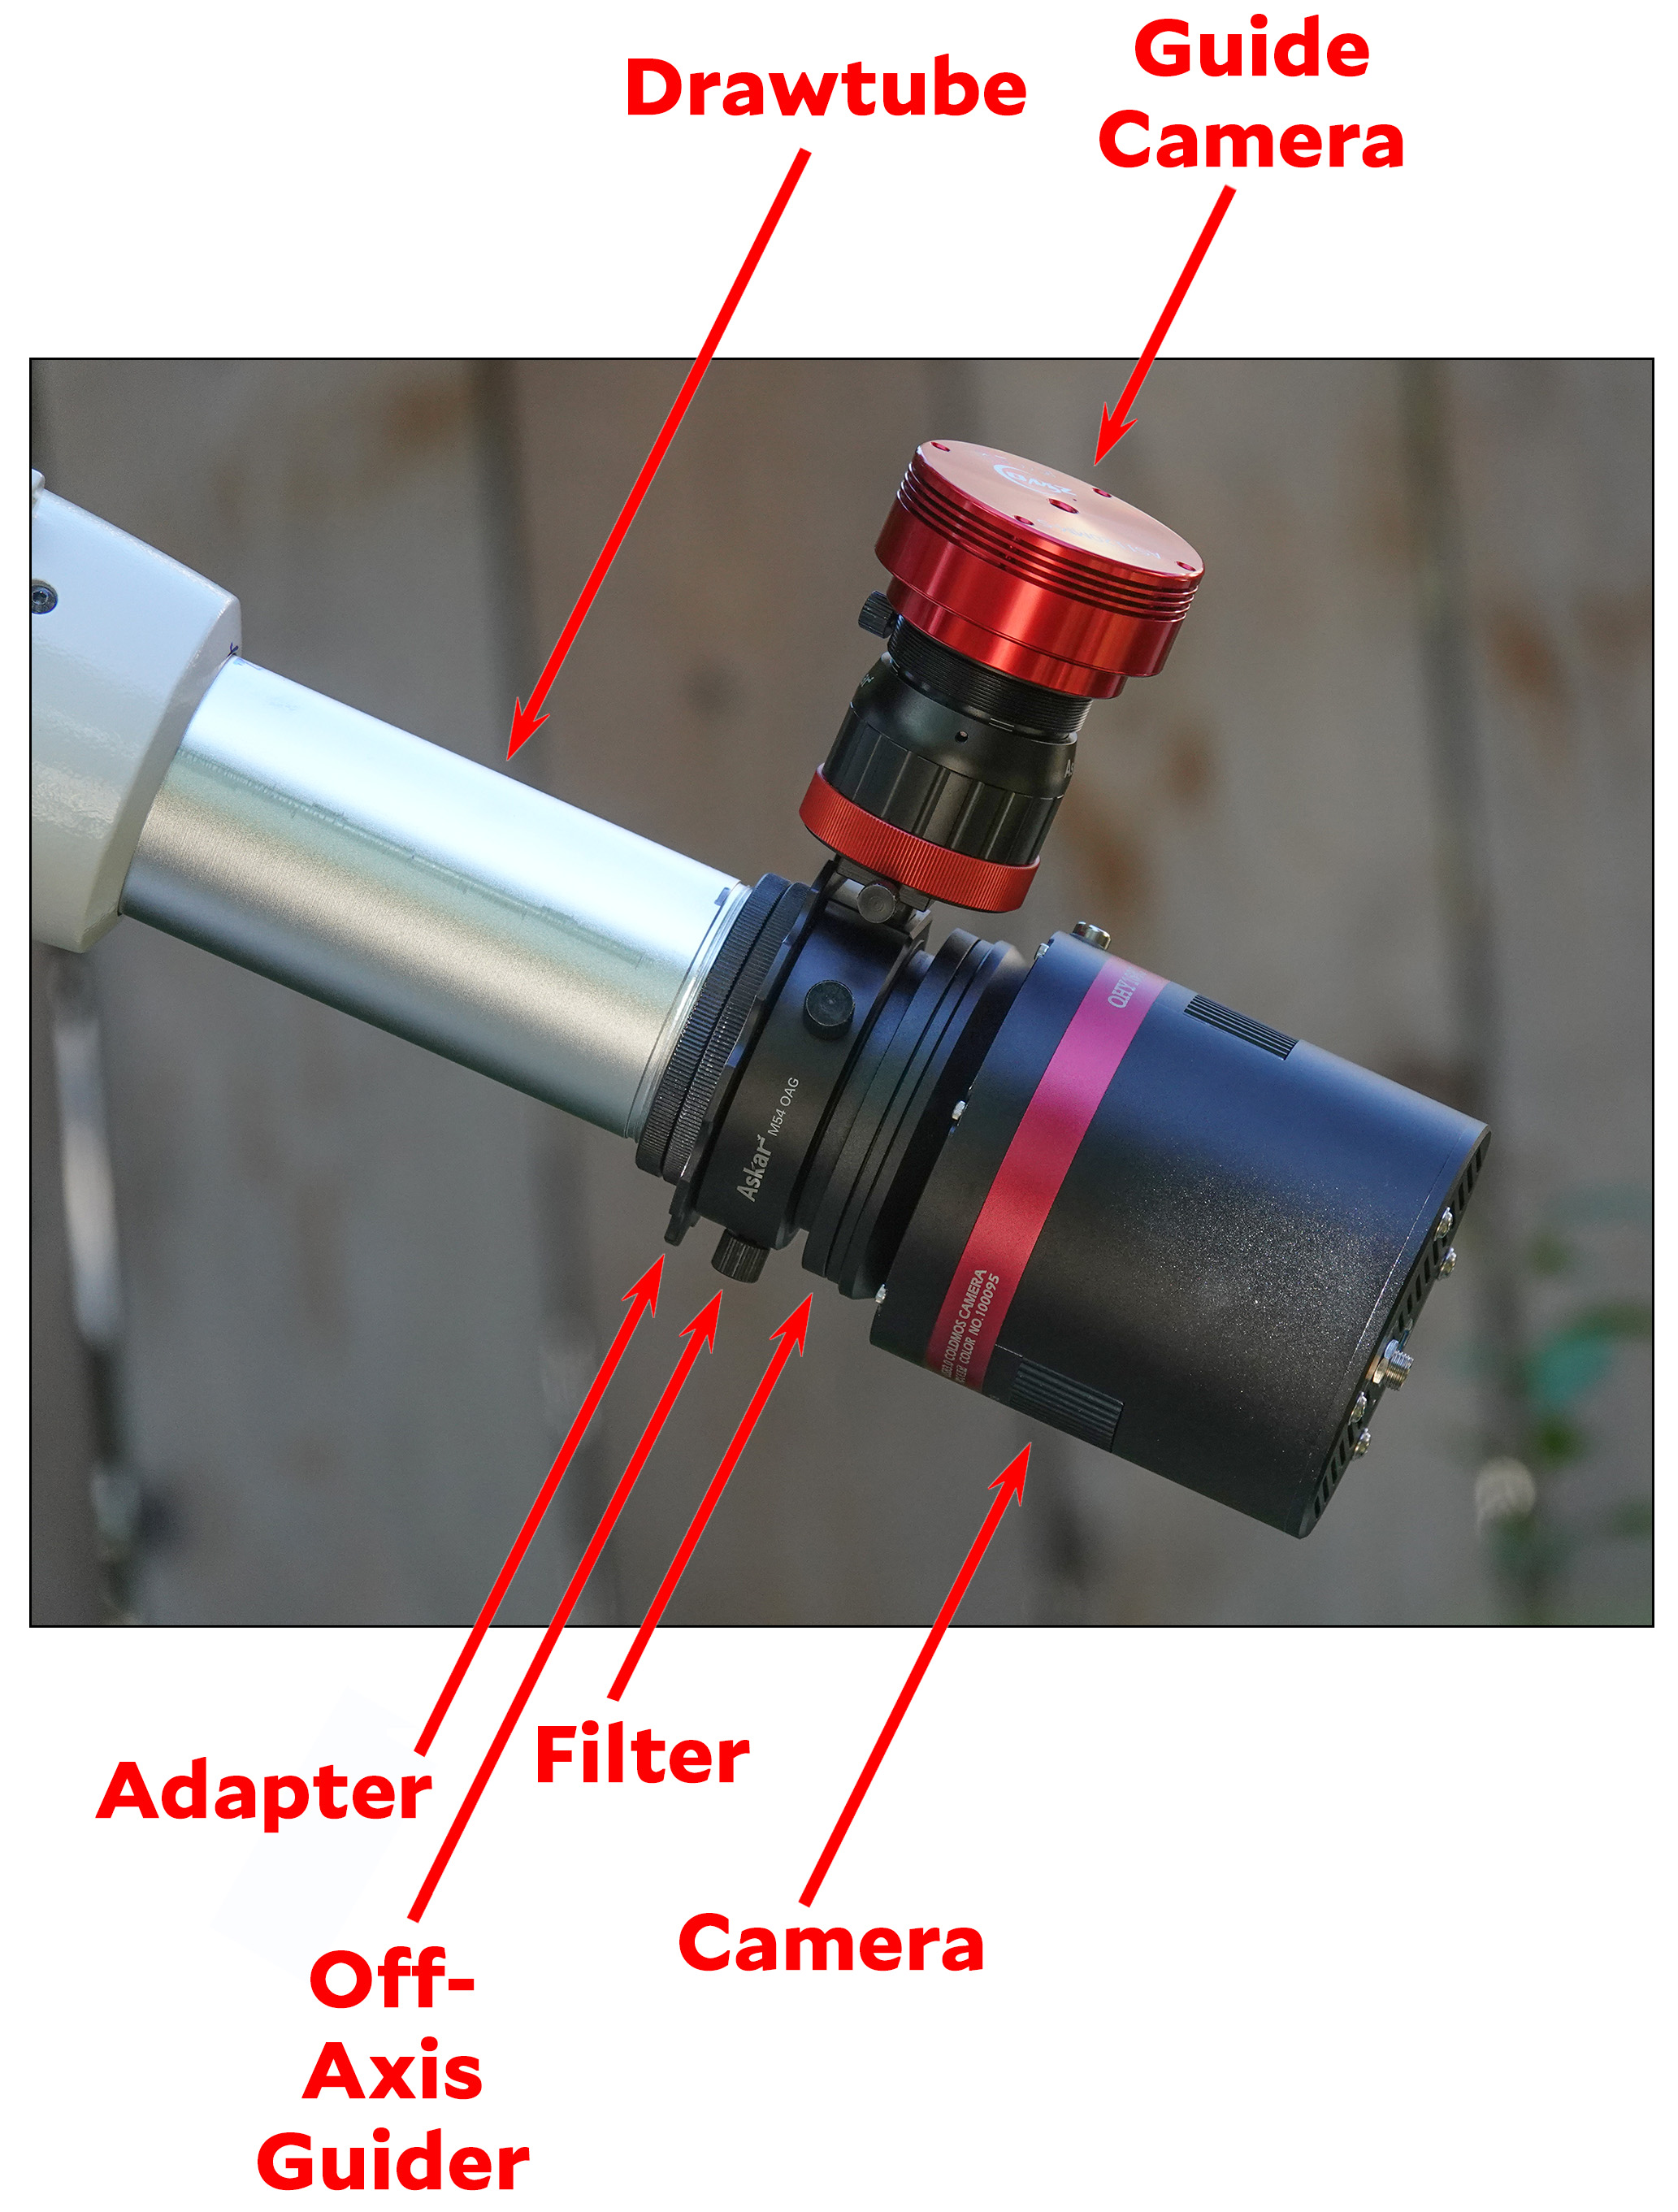
The drawtube is controlled by the focusing knobs and moves the optical train in and out. My telescope uses a Crayford style focuser, and it's not that great. I'm planning to replace it with a PrimeLuce Esatto 2" electric focuser.

The adapter transforms the M56 threads on the drawtube to M54, which everything else uses. The numbers are in millimeters.

The off-axis guider (OAG) is an Askar with a 10mm prism. The prism draws off a small bit of the image from the telescope and sends it up to the guide camera.

The guide camera is a ZWO ASI120MM-S. The S, apparently, means that it supports USB 3.0, which it turns out I need. I'm still not entirely sure why. In any case, equatorial mounts never compensate perfectly for the rotation of the earth, so a guide camera is used to lock onto a star and produce occasional pulses to keep the mount precisely on target.

The filter holder is just what it sounds like. There are lots of useful filters you can get, including simple light pollution filters, sun filters, moon filters, and so forth. However, the most common use of filters is to capture separate exposures of the various emission lines emitted by nebulae. These are called narrowband filters and the three most common are Ha (Hydrogen-Alpha), S-II (Sulfur-II), and O-III (Oxygen-III). The basic idea is to use a monochrome camera and then capture individual images with each of the filters. The final image is created via specialized software that puts the images together into a high-resolution color image.

At the moment, my filter holder is empty. I don't use it at all.

The camera is the heart of the optical train. Mine is a QHY 168c, a color camera that uses a Sony IMX071 APS-C CMOS sensor. This is a 16 megapixel sensor with 4.8um pixels. What makes it specially suited for astrophotography is the built in cooler, which cools the sensor by 30-40°C compared to the ambient temperature. This produces images with far less noise than an ordinary DSLR.

Finally, there's the software. This has improved massively over the past decade or two and now performs miracles. At the moment, the software I use is:

EQMOD to control the mount.

N.I.N.A. is my basic capture software. It connects to everything and controls polar alignment, image capture, camera control, platesolving, and a hundred other things that I don't use. Basically, NINA uses platesolving to figure out where the telescope is pointed and then syncs this information with the mount. After that, you can simply tell NINA what object you want to slew to (the Iris Nebula, for example, is NGC 7023) and NINA will move the scope to the exact coordinates of the object.

PHD2 is used for autoguiding. Pretty much everyone uses PHD2, so I figure I might as well too.

Astro Pixel Processor is currently my program of choice once I get home and need to create a final image. Generally speaking, the way modern astrophotography works is that you use long exposures and lots of images that get stacked together. My Iris Nebula image, for example, used 51 images of 60 seconds each. For better results, I would most likely capture a few hundred images of 2-3 minutes each. Or maybe combine some images of different exposure times. Sometimes it takes a bit of experimentation to figure out the right combination. In any case, APP produces far better stacked final images than any other program I've used (though I can't say that I've used an awful lot of them yet).

Photoshop is my choice for final touch-ups. APP produces pretty good images out of the gate, so I don't need to use Photoshop for much. But I'll usually do a little bit of stretching, as well as adding extra contrast since APP seems to produce generally grayish images.

And that's it! As of last night I believe that I've finally finished the first phase of my new hobby, which is just getting all the software to function. Not function well, just function. The only exception is that I'm still not sure I have autoguiding working. I may be able to find out tonight depending on the weather.

With that done, I can start to actually learn about astrophotography. That is, not just how to take a picture, but how to take better pictures. This is the part I've been looking forward to, and I expect it to occupy me for quite a long time.
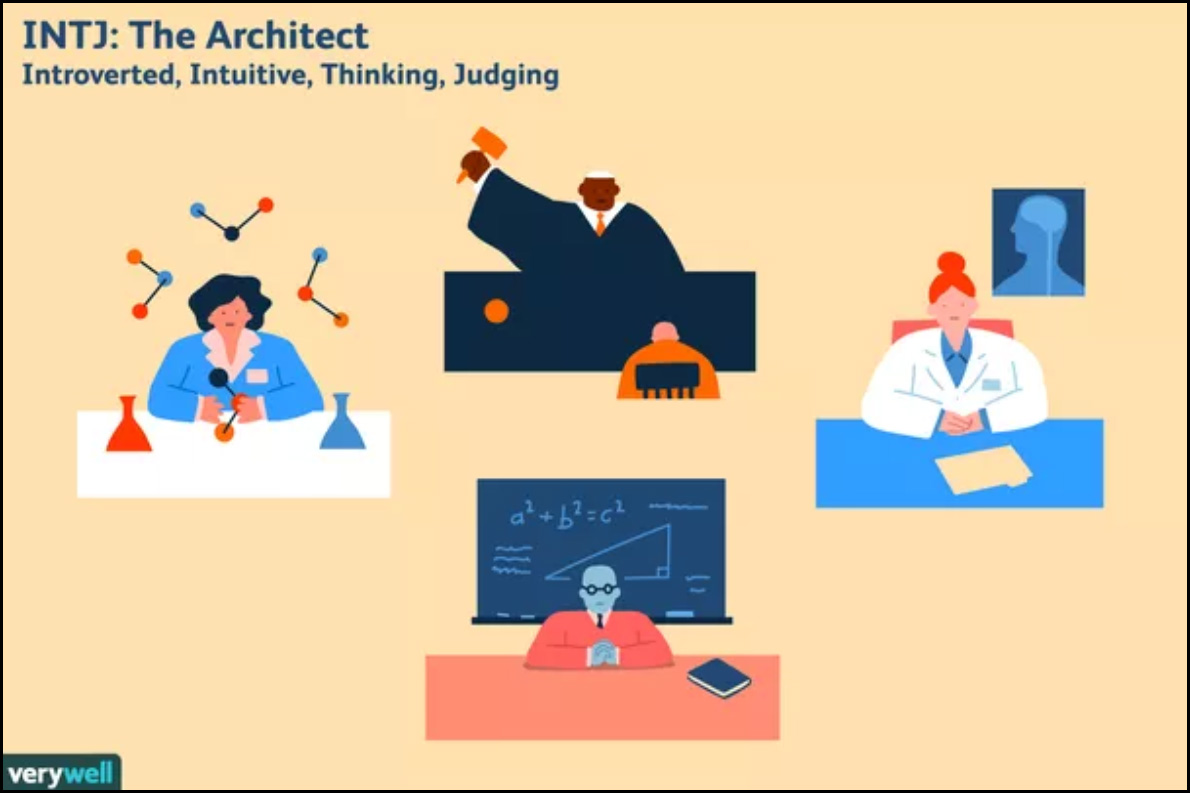
I have no special reason for posting this. I just happened to run across yet another item fretting over the possibility of China becoming bigger than the US and what that would mean for the future of the galaxy. But come on. Sure, total GDP matters for the heft it allows you to throw around on the world stage, but the real measure of a nation's economy is GDP per capita. Here it is:

China has obviously grown very impressively on a percentage basis. Nevertheless, in absolute terms their GDP per capita has grown $10,800 since 1980 while ours has grown $28,800. Even if you're more bullish on China than I am¹ and assume they'll enjoy endless exponential growth while the US is stuck with linear growth—as shown in the chart—by 2055 China will still have less than half the per capita GDP that we have.

China is not a country to be taken lightly. But it's also not a country to panic over. They have a whole lot of catching up to do, and the odds are that they can't do it any time soon.

¹Reasons I'm not that bullish on China: (1) they have an aging population, (2) they are coming up on the middle-income trap, and (3) they are addicted to autocratic control of both their population and the economy. The most important of these is #3. In the long run, they'll lose out to free market capitalism and a free populace.

According to Know Your Meme, the platforms that generate most of our memes have changed over the past decade:

Back in the day, when dinosaurs trod the earth, our memes mostly came from YouTube and 4chan. Today, in our sleekly modern era, most of our memes come from Twitter and TikTok.

I'm not sure what conclusions to draw from this, so go at it in comments. Are today's memes better or worse than they used to be?