Skip to content

I haven't seen this confirmed anywhere, so for now I'll put it into the "interesting if true" bucket:

CNN reports that "Cheaper oil and Ukraine war are blowing a hole in Russia's finances," and that's based on official information from the Russian Finance Ministry. So it's certainly plausible that they're also cutting the budget. In any case, it appears that Western sanctions are hitting Russia harder than recent punditry has acknowledged.

This is supposed to be a Michaelmas daisy, but Wikipedia informs me that the Michaelmas is part of the aster genus, which by decree is now found only in Eurasia: "After morphologic and molecular research on the genus during the 1990s, it was decided that the North American species are better treated in a series of other related genera."

So . . . maybe it's an African daisy? I don't know. The good folks of Louisiana don't seem to have kept up with their taxonomy and mostly still call this a Michaelmas daisy. And why not? Who cares what a bunch of egghead botanists think, anyway?

November 4, 2021 — Lake Martin, St. Martin Parish, Louisiana

The railroad strike has been averted at the last second:

Freight rail companies and unions representing tens of thousands of workers reached a tentative agreement to avoid what would have been an economically damaging strike, a relief for businesses and consumers and a win for President Biden, whose administration helped broker the deal.

The breakthrough came just hours before a critical deadline that would have allowed workers to strike and followed all-night talks with unions and industry leaders that were brokered by Mr. Biden’s labor secretary, Martin J. Walsh.

Hmmm. Maybe my cynicism gene has suddenly ruptured, but this sure has played out in a way perfectly suited to make Biden look like a great statesman. Think about it: there's no progress for months; panic sets in during the final week; and then with one day to go Biden steps in and brokers a routine compromise that looks to me like it could have been reached at pretty much any old time.

Not that there's anything wrong with that! If it really went down this way, it's just good politics. But it kind of makes you wonder if unions were doing Joe a little dramatic favor here.

Here is the latest release of the data on retail sales:

There's nothing much to report, literally. Retail sales growth has been almost completely flat since February and it continued that trend in August, rising only 0.7% from the previous month on an annualized basis.

This suggests that Americans are on a fairly even keel these days. They aren't worried enough about inflation to change their buying habits, but they aren't confident enough to go on a buying spree either.

People are often badly mistaken about how much the average person earns in the United States. So as a public service, here's a series of charts based on yesterday's release of 2021 income levels from the Census Bureau.

The top chart is to remind everyone that there are lots of different types of wage earners and you have to pay attention to which is which. Individuals are just what they sound like. Households are any group of people living in a single housing unit, whether related or not. Families are groups of related individuals living together.

Note that the median individual income is $37,522. This is for all individuals, including those who have part-time jobs or no job at all, and it's the one that's normally used (including in all the charts below). However, the median income for workers with year-round full-time jobs is $56,473. It's a big difference, and which figure you use depends on what comparison you happen to be interested in.

If you feel like doing some slicing and dicing of your own, all the raw data is here.

Where have I been all day?

Well, I woke up a little late and found nothing interesting in the news. The queen is still lying in state. The Russian army is still inexplicably incompetent. The FBI is still issuing subpoenas to the 1/6 rioters. Railroad owners are still threatening to shut down the entire country's rail system. And LA's sheriff is still a huge douchebag.

So I ate breakfast. Then I decided to let Charlie into the yard for the first time in several months to see how he did. Answer: he roamed farther than I'd like, but still only a couple of houses away and he came back of his own accord.

Then I ended up spending a bunch of time on some charts, but I got hungry before I was finished so I went to lunch and then bought myself a pair of astronomy pants.¹ I figured I would post the charts when I got home, but a friend sent me a question that I figured I could answer right away and . . . it turned out I couldn't because the stupid Census Bureau doesn't provide easy access to old income figures.²

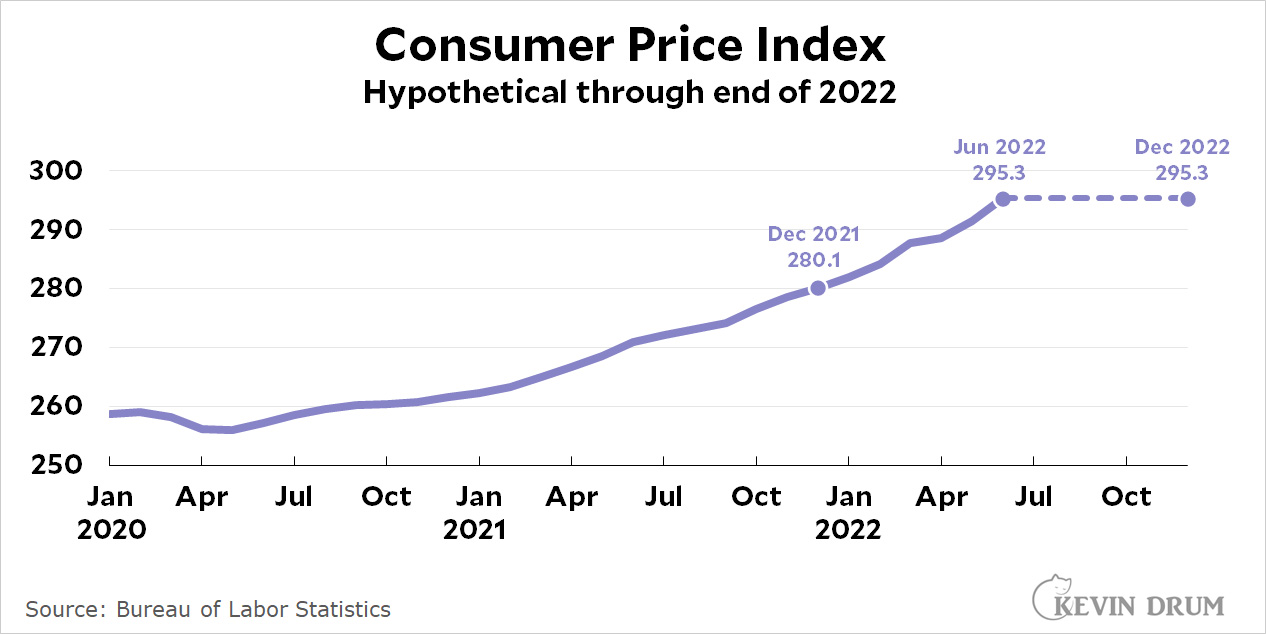
Anyway, here are the charts. They aren't designed to make a point, just to satisfy some curiosity on my part. They show which categories of the economy are contributing the most to inflation. I left out gasoline and housing, since they present some difficulties I didn't feel like taking the time to solve, but everything else is there. Note that this time I simplified the charts by calculating the trendlines and then erasing the actual data.

¹What are "astronomy pants," you ask? Well, it's pretty warm out here, and years of chemo has made me cold blooded. So I normally wear shorts when I go out. But twice I've tripped and skinned my knee, so I figure it's time to wear long pants even if I don't like them. So I got some.

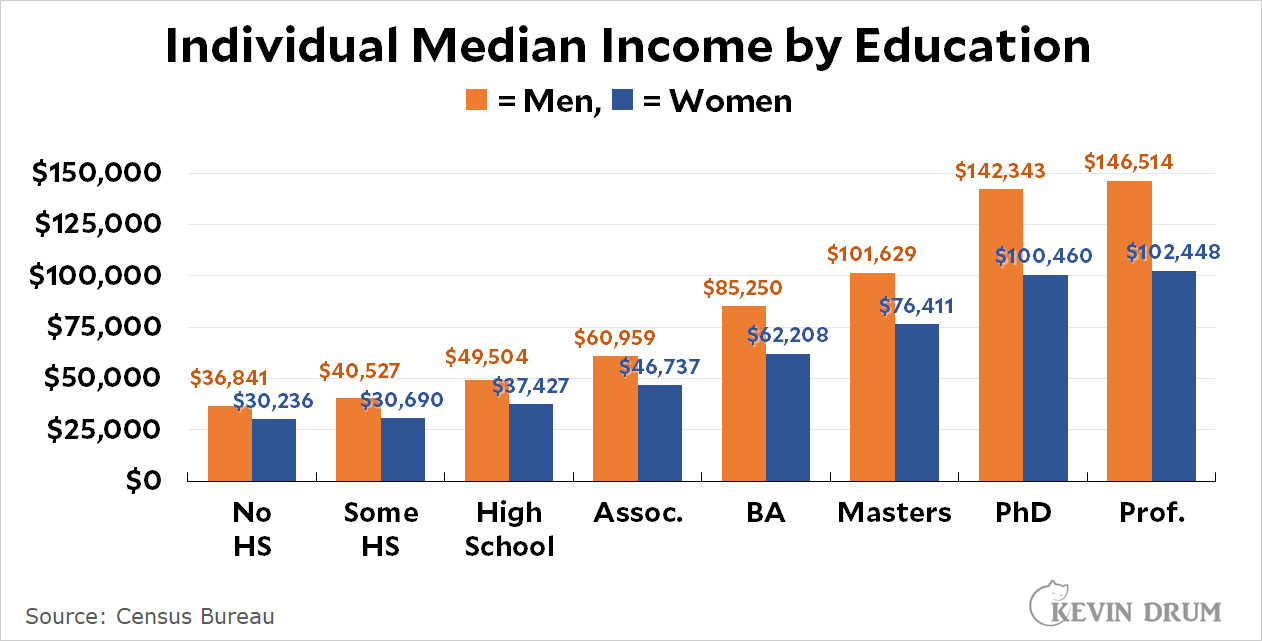
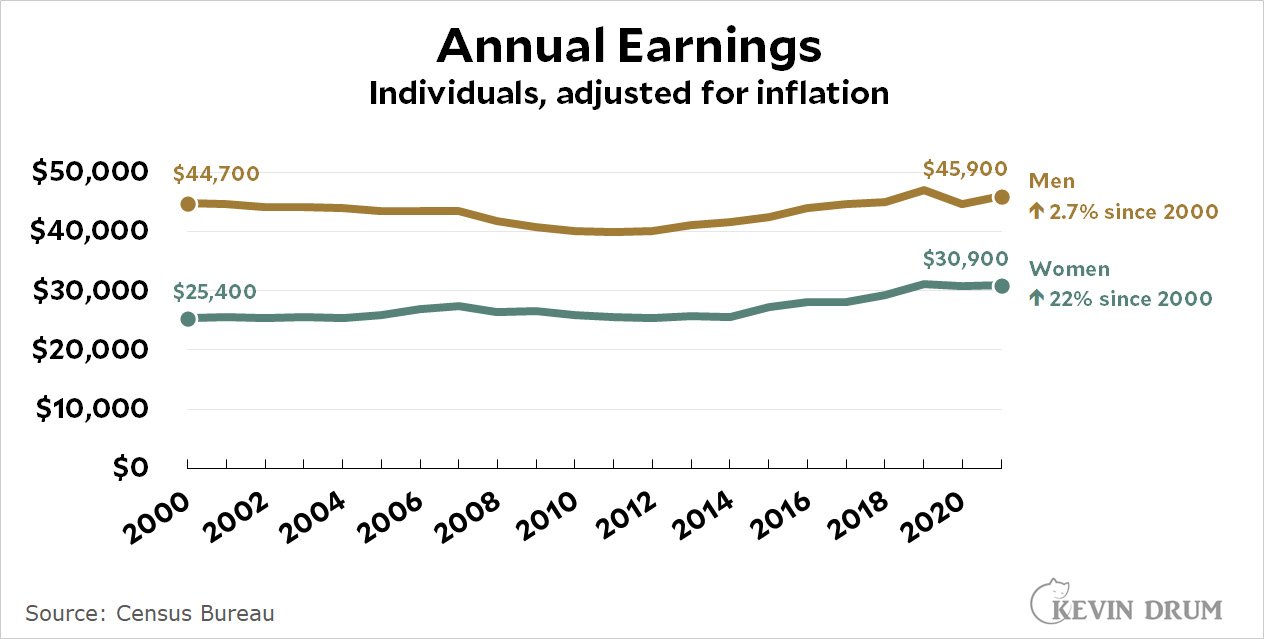
²In case you're wondering, he wanted to know how much annual earnings had changed since 1979 for (a) men, (b) 25 years and older, (c) with only a high school education, and (d) who are working full-time. The answer, adjusted for inflation, is $1,214 in 1979 and $952 today. That's according to the Census Bureau, anyway. The BLS has a different estimate. Note that virtually all of this decrease took place in the supposed boom times of the 1980s.

Most of the time, the "headline" CPI is reported as the rise in prices over the past year. For example, one year ago the CPI stood at 273.1; today the BLS reported that in August 2022 it was at 295.6. That's an increase of 8.2%.

But prices have been flat for the past two months. Suppose this continues through the end of the year. CPI would look like this:

If you calculate inflation the usual way, December's inflation rate would be reported as 295.3 ÷ 280.1 = 5.4%.

But does that make sense? If prices have been flat for six months, a much better description of actual life at the moment is that inflation is running at 0%.

Now, this is all very well for six months of data, but what if prices are flat for just one month? Or two? That happens to be the case right now: prices have gone up less than 0.1% over the past two months. But one or two months might just be a coincidence since there's a lot of spikiness in this data. That's why I like to look at monthly prices—so I get a sense of what's happening right now—but then draw a trendline through the data so that I can smooth out the spikes and see the longer-term direction better.

When you look at yearly inflation, the past 11 months of increases are already locked in. Unless you're expecting deflation—i.e., prices going down—the yearly number is always going to be very close to what it was the previous month. That's not very helpful.

When everything is nice and stable, none of this matters much. But when inflation is rising or falling and you need to make decisions about what actions to take, you need monthly data and you need to put it in the context of a trendline. That's why I do it that way.

We got more than just inflation figures today! The Census Bureau has released the 2021 estimates of annual earnings. Here it is for individuals:

Men's earnings were up $1,200 last year. Women's earnings were up $150. However, no one has made up for last year's dip. Men's earnings are 2.2% below their 2019 level; women's earnings are 0.7% below.

Since the year 2000, men's earnings have increased 2.7% (adjusted for inflation). Women's earnings have increased 22%.

You can find the complete Census income figures here. They include individual, family, and household estimates, and are reported by race, sex, age, region, education level, and marital status.