
Alan Blinder, a Real Economist™, says that inflation is way down:
Over the past five months (June to November 2022), inflation has slowed to a crawl. Whether measured by the consumer-price index, or CPI, which most people watch, or the price index for personal consumption expenditures, or PCE, which the Federal Reserve prefers, the annualized inflation rate has been around 2.5% over these five months.
Yes, you read that right. Yet hardly anyone has noticed this stunning development because of the near-universal concentration on price changes measured over 12-month periods, which are still 7.1% for CPI inflation and 5.5% for PCE inflation.
This is a good opportunity to get something off my chest: Anyone who didn't notice this stunning development is an idiot. Or maybe a visceral inflation hawk who needs to be put out to pasture. If you spent the past year obsessed with year-over-year figures just because those are the ones we usually use in normal times, you should not be allowed anywhere near monetary policy. Please return to the 1970s where your brain is apparently stuck permanently.
And in case you're wondering if Blinder is cheating by using a five-month average, which is admittedly a mite unusual, here's a chart:
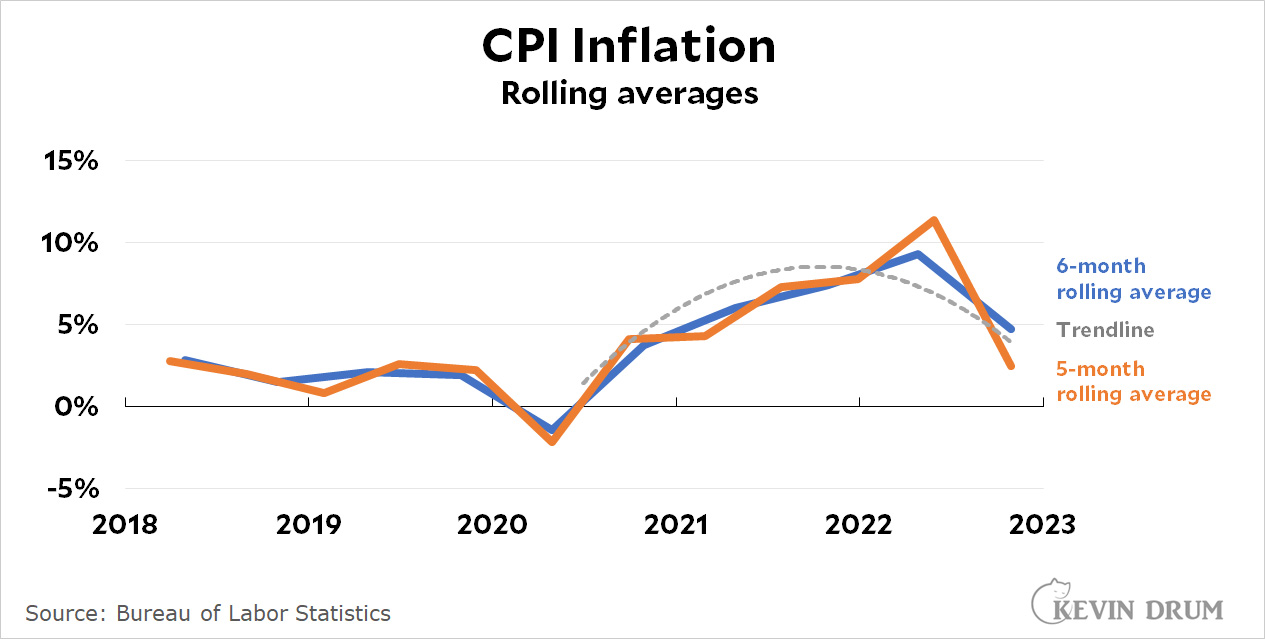 It so happens that inflation slowed very suddenly in July, so a five-month average that eliminates the June number is indeed a slight bit of cherry picking. But not much. The more traditional 6-month average shows about the same thing. For comparison, the dashed gray line is my usual least-squares regression, which I happen to think is the best of all.
“Least squares regression” usually means a linear fit. You dashed line is not linear, so I have no idea what kind of fit it is.
Least squares fit refers to any sort of polynomial fit, not just a first order fit. Kevin neglected to tell us what sort of polynomial he was using, but this does’t mean it wasn’t a least squares fit.
Doesn’t even have to be polynomial; you can do a least-squares fit to pretty much any function. For each point in the data, calculate the square of the distance between the data and the function, sum this up for all of the data points, and then adjust the parameters of the function to minimize the total squared distance. Hence 'least squares'.
How you actually implement the 'adjust the parameters of the function' part depends on the function; polynomials are fairly easy to work with, but are hardly the only possibility.
Start making more money weekly. This is valuable part time work for everyone. The best part ,work from the comfort of your house and get paid from $10k-$20k each week . Start today and have your first cash at the end of this week.
Visit this article for more details.. http://incomebyus.blogspot.com/
When people talk about linear in these situtations, they don't mean the higest power seen in the model; they mean that the model is made up of linear combinations of whatever they're regressing on. Remember, a vector space is simply a collection of things that you can meaning scale and add those things. In fact the space of polynials with a bound on the highest power is a classic example of a vector space that doesn't have anything to do with geometry.
Least squares usually just means that you're not weighting the data by any kind of error bar. You're just using the sum of the square of the distances between the y-value of the function, whatever it is (linear, quadratic, something else entirely, or a combination of functions), and the y-value of the data, with no consideration of whether that distance should be considered more significant for one data point or another. Sometimes you might do the least squares distance in terms of both the x- and y-variables (but more than likely Kevin is just doing the y-values). Start putting weights on the data, and you're doing a similar kind of fitting, e.g., chi^2 where the squared distance is compared to the square of an error bar. You can drive yourself crazy thinking about all the inherent biases in any particular fitting scheme or smoothing scheme or combination thereof. And all of this would likely make any mathematician working in Bayesian statistics quietly weep.
Team Transitory just keeps on winning!!!
No wage-price spiral. Just an almost step function increase in prices with ripple effects that are settling down now. Plus a series of unfortunate events.
But the Fed does seem to be fighting the last battle and/or way to caught up in "signaling". And Robert Reich points out the Fed policies hurt the working class while inequalities are really hurting people and the economy:
https://www.theguardian.com/commentisfree/2023/jan/08/us-monopolies-inflation-unemployment-rising-prices-federal-reserve
This is the real story. Prices were raised because they could be and there was a viable narrative build around doing so. The core of inflation is price gouging, plain and simple.
Agree with you and golack. Price gouging, not just domestically, but global.
I feel that OPEC knew about Putin's plans and did the right thing, for themselves, by restricting oil production, which seems to me to be the "viable narrative" adopted by most of the market, "gas went up making our deliveries more expensive", etc. and so on.
I wonder if a .cubic rather than quadratic would give a better fit.
Kevin will use whichever best fits … his narrative. Collect N different Drumcharts of inflation and I suspect you will see nearly N different flavors of trendline used between them.
Core PCE inflation over the same 5 month period ran at a 4.1% annual rate.
Everyone knows gas prices have come down a lot since June. That is not a meaningful measure of the economy.
The current reasonable headline number is composed of many offsetting pieces. Even core inflation has some prices going up and some going down. If someone can explain to me why either (a) core goods prices will *continue to fall* or (b) why core services will reverse trend and start to moderate their increases, then I will relent. But until then, Kevin is calling people idiots while he himself uses a very facile method to examine inflation. I simply don’t believe he’s that facile.
For the umpteenth time, inflation is a rate of change (specifically, a rate of increase in CPI or PCE). Inflation ends when prices stop rising; prices need not fall to bring inflation down.
Kevin has given reasons why he believes the price indexes will return to acceptable rates of increase. Some commenters have given additional reasons. No one here has given a plausible reason for prices to continually increase 'forever'. The burden is properly on the inflation hawks to point to the mechanism that will perpetually drive price increases.
I am not sure what about my comment made you think I don't understand that inflation is a rate of change.
In the last five months, goods prices *have been* falling. Not rising slower - falling. A lot of this is energy prices, but other goods prices have been falling as well. *DESPITE THIS*, inflation has been positive - because services prices have been increasing fast enough to more-than-offset the decreases in the price of goods.
But I don't know why prices would *continue* to fall - gasoline prices are back to where they were a year ago. Are they going to keep falling? Maybe! But I'm not sure why they would. And same with furniture prices and car prices and everything else that's been falling recently - unless those prices keep falling, we will lose the benefit of falling goods prices in inflation, and we'll be left with services prices rising.
A big chunk of services is housing, and housing "prices" (as measured by the index) will continue to rise for a bit and then start to fall, since these prices are measured on a lag. But most of services prices are related to wages. I'm not seeing wage increases slow down until the labor market cools off more.
But maybe I'm wrong! Tell me your theory of the case! But don't say "Kevin has explained why" when he has not! All he does is draw charts 12 different ways until he finds the one that proves his point.
“we'll be left with services prices rising”
Why? What mechanism do you suppose will continue to drive them up ceaselessly?
“housing "prices" (as measured by the index) will continue to rise for a bit and then start to fall”
They are already falling: https://fred.stlouisfed.org/series/CSUSHPINSA
Real wages have been dropping, I.e. increases have been less than inflation: https://fred.stlouisfed.org/graph/?id=LES1252881600Q,
Man, I’m not even sure how to respond to you. You keep making statements that seem to suggest you think I am ignorant, but actually betray your own ignorance.
OF COURSE Case-Shiller is already falling. This is common knowledge for anyone following economic news. The inflation indices don’t use Case-Shiller. Home prices in general are not included in inflation measures. Inflation indices use a somewhat-complex metric called “owners’ equivalent rent” to measure the cost of living in a home you own. And those calculations are updated slowly. That’s why I said “housing "prices" (as measured by the index) will continue to rise for a bit and then start to fall”. Once the index OER calculation catches up to facts on the ground, we’ll start to see that piece of services inflation cool off.
As for why I think services prices besides housing are likely to continue to rise at their current, elevated pace: you said so yourself that real wages have been falling. That’s not sustainable. Workers will continue to demand “catch up” wage increases even though inflation has moderated. (And rightfully so!) but since services inflation is closely linked to wages, that will continue to put upward pressure on services prices.
But I might be wrong! We really don’t know what’s going to happen. What I object to is Kevin (and certain commenters) acting like this stuff is easy and obvious and that anyone who doesn’t see things the way they do is either an idiot or actively trying to hurt workers and/or Joe Biden.
This *isn’t* easy, and it’s *not at all* obvious what’s going to happen. And people who care about workers should care about inflation, which is the number one thing workers are concerned about right now.
I always wanted one of those jobs where I could ‘demand’ a salary increase. Sigh.
Looking at the BEA and St Louis FRED site, core PCE appears to be around 3.6 yearly rate over the 5 month period.
3.5 yearly rate over the last 3 months.
2.6 over the last 2 months.
Not only was inflation at 5 months much lower than you thought, but it has continued to fall.
The rate of increase for PCE services has slowed in the most recent 5 months compared to the 5 months prior. It's unclear what trend or trend reversal you are demanding to see, but this slowing trend appears consistent with the point Kevin is making.
Thanks for the numbers.
My source is here:
https://apps.bea.gov/iTable/?reqid=19&step=3&isuri=1&1921=survey&1903=84
"PCE excluding food and energy" is core PCE inflation. Rates for July, August, September, October, and November are 0.1, 0.6, 0.5, 0.3, & 0.2 respectively. (Those are all percentages, btw).
Since those are increases from the prior month, you add 1 and multiply them to the get the cumulative impact:
1.001 * 1.006 * 1.005 * 1.003 * 1.002 = 1.0171.
Since that's five months, you need to raise that amount to the (12/5)ths to get an annual rate:
1.0171 ^ (12/5) = 1.04155 - which means the annual rate is 4.155% (I rounded down in my original post, it seems).
Happy to hear how you did your math.
Similar math, but I used PCE figures out to the thousandths digit available at FRED and the BEA site. I don't have the link.
To address your services question: over the last five months, services prices increased at an annual rate of ~5.2% (same method as above, but with the services numbers of 0.1, 0.6, 0.6 ,0.4 , & 0.4 for July - November). You are correct that this is lower than the ~5.7% rate from the prior 5 months.
However, a big chunk of that change is from energy goods and services, which accelerated quite rapidly February - June and then came down quite a bit July - November.
But forget that. Let's say that that services continue to to decrease by ~0.5% points every 5 months. That means 2023 services inflation will be about 4%, 2024 services inflation will be about 3%, and we won't get back to normal until 2025.
Now, that would be ok if goods prices offset by continuing to decrease. Is that going to happen? Or are core services prices going to decelerate faster than they are currently? (And again, that's to the extent core services prices have decelerated at all, as I think the deceleration we've seen this year has been attributable almost entirely to energy service decreases).
Literally no-one on earth can know the future price changes that will occur over the next several months.
Guessing what the rate of change will be in 2024 or 2025 is just a wild guess.
We can make a good guess that the impact of higher interest rates will have a more dramatic impact on prices over the next 6 months than they did over the past 6 months. Combined with the direction of change in recent months and the lack of future fiscal (taxes or spending) expansion from the government, signs certainly point to less inflation. But how much less is just a wild guess.
I completely agree with this.
You're on the mark. Thank you.
All of my meatspace friends still think inflation is high and is barely easing. People in the real world are still not used to paying the higher prices, so even though the prices have stopped increasing (as shown in the data), they still FEEL higher. That's why the narrative is so persistent. It's one reason why using longer term numbers as at least a reference point is a good idea (at least politically, so you can know how things will play) - because economics is a behavioral science, and gut feelings are part of human behavior.
That said, there isn't just a concentration on the 12-month numbers but just a general media/cultural narrative around "SHIT COSTS TOO MUCH THESE DAYS." It's always been there and always will be, and people will always fall victim to it.
Prices 'feel' higher because they are higher. But prices that remain stable at a higher level than a year ago contribute nothing to inflation, because inflation is a rate of change.
The Fed knows this. The Fed has also been fairly clear that cutting labor off at the knees is an explicit end goal in itself. It isn't just a useful tool to control overall inflation. Reducing demand for labor and wage gains is a goal. This will be true no matter what overall inflation is doing.
An anecdote of the inflationary spiral: This morning I bought a pack of two (2) 9-v batteries. It cost over $16.
A pack of 8 costs $16 on Amazon.
Blame the media culture. They are so fixated on their sacred duty to "hold the powers-that-be accountable" that there is no motivation to explain to the public when something gets better.
Darn right the five-month interval was cherry-picked. And even so, inflation of 2.5% annualized, achieved by virtue of a huge drop in energy prices after their huge run-up over the preceding *year*, does not achieve the Fed's inflation target of 2%.
By the way, who thinks we can comfortably trust the opinion of, er, *one* economist? You've heard it said: if we lined up all the economists in the world end to end, they'd still all be pointing in different directions.