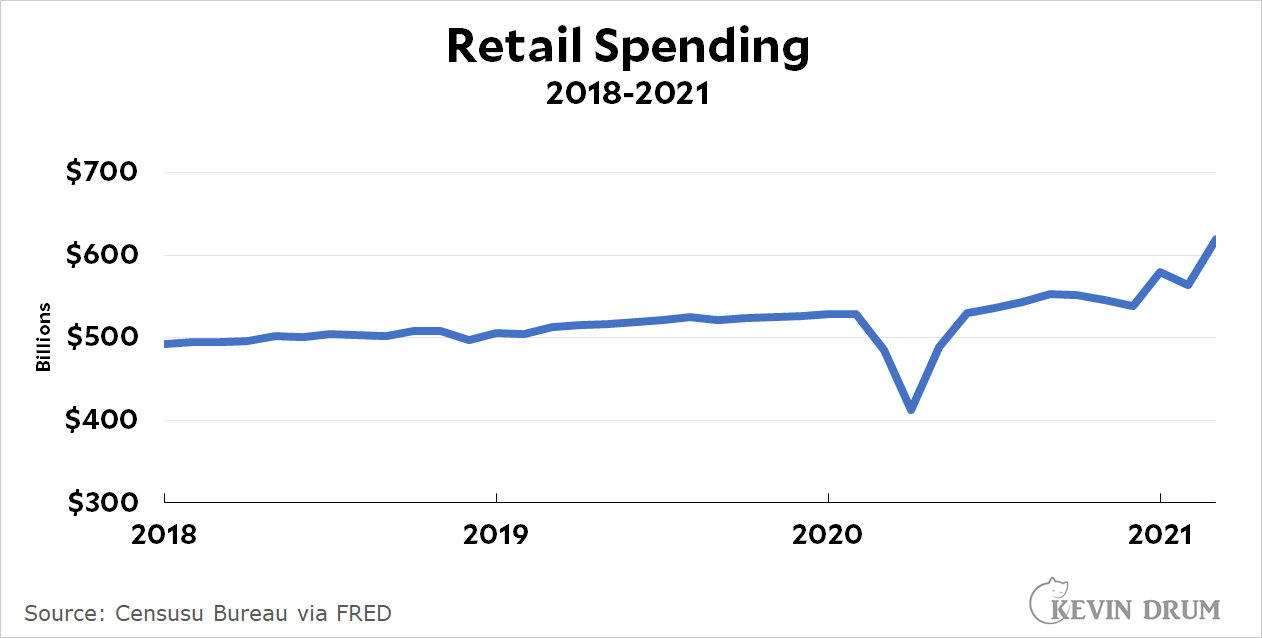
The success of the vaccination program and the imminent end of the pandemic put Americans in a binge spending mood last month:

But once again we have a problem. How much was spending up? Spending plummeted a year ago when the pandemic started, so if we compare to last March then spending was up 28%. That hardly seems right. But if we compare to last month spending was up 9.8%, an annual rate of 112%. Both of those seem faintly ridiculous, no?
On the other hand, if I use the technique I introduced yesterday—compare March spending to two years ago and then divide in half—I get an annual growth rate of 10.4%. That's unofficial, but it still strikes me as closer to the truth than any of the others.
Alternatively, you can toss out the numbers and just be satisfied with "Retail spending was way up last month. Hooray!"

The "truth" is right there in the graph of absolute spending that Kevin reproduces. You can see what happened in the past and recently and make your own conclusions. Trying to reduce everything to an average over some arbitrary period does not improve understanding of what has been going on. In some cases deriving statistics (an average is a statistic) is very helpful or even necessary, but in this case one number is just not enough.
Inflation is similar as I have tried to explain in previous comments - if you want to know what prices have been doing, look at the graphs of CPI at FRED.
There are things you can do with several numbers. For example you can draw a trend (as Kevin likes to do) through 2018-2020 and compare the current spending (or prices) with that trend. But one glance at the diagram gives you the same information (if you are used to reading such diagrams).
Kevin's problem is that he is trying to correct for seasonal variation (hence comparing March to March), but he's clearly using data that is *already* seasonally adjusted. Unadjusted retail sales would have a giant spike every December, and a deep trough every January/February.
So, you are correct: Just eyeball the graph and it gives you what you want.
We're still working on filling in the divot.
You shouldn't try to extrapolate an annualized growth rate from recent data. Retail sales are through the roof right now because the gummint just sent everybody a $1,400 check. Wait till May to see where it shakes out.
I have a friend who runs a retail store. He has been working practically nonstop the last few weeks, raking in the "Biden bucks." The same thing happens each spring when people get their tax refunds.
One more example of the difference between homo economicus and actual human beings.