
As productivity goes, so goes the nation. Or something like that. In the fourth quarter of 2022 labor productivity increased at an annual rate of 1.7%. That's a little higher than the average of the past decade. Here is productivity since the end of the Great Recession:
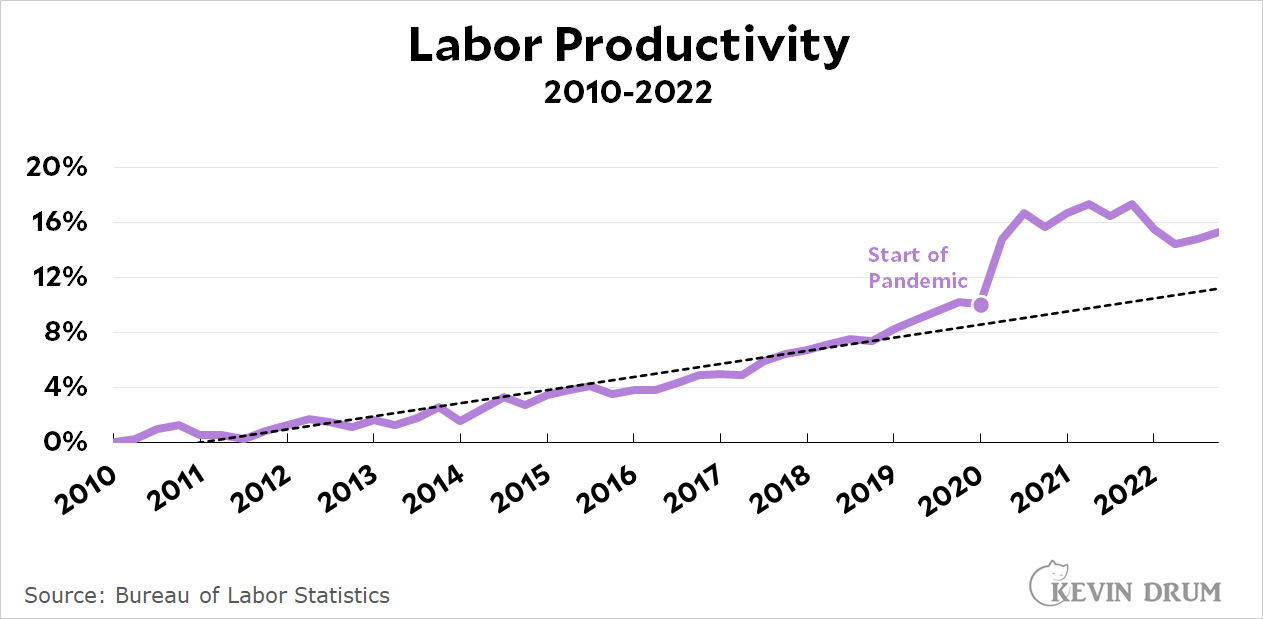 Productivity shot up during the first quarter of the pandemic as output declined but people were furloughed or laid off at an even greater rate. A year later we lost some of those productivity gains as companies went on a hiring binge in 2021, but we're now starting to gain it back as hiring has eased but output continues to climb.
This is the two-faced coin of productivity. Higher is better, because it means we're producing more stuff per worker. But is that because we're shedding workers (bad) and still producing more stuff? Or that we're adding workers (good) but producing lots more stuff? In Q4, it was the latter. Hours of work increased 1.4% but output was up even more at 3.1%. So it's good news all around.
In real-economy terms, productivity can be measured as widgets produced, or units of service provided, per hour worked, output divided by input. Changes are overwhelmingly the result of technological changes to the system of production. But since you can’t add up hamburgers, automobiles, insurance claims, etc., output is measured as value added. Unfortunately, that contaminates what should be a measure of system efficiency with artifacts like pricing, exchange rates, changes in in-process inventory, and more. Short-term, it is likely that changes in productivity as measured by BLS are dominated by these artifacts.