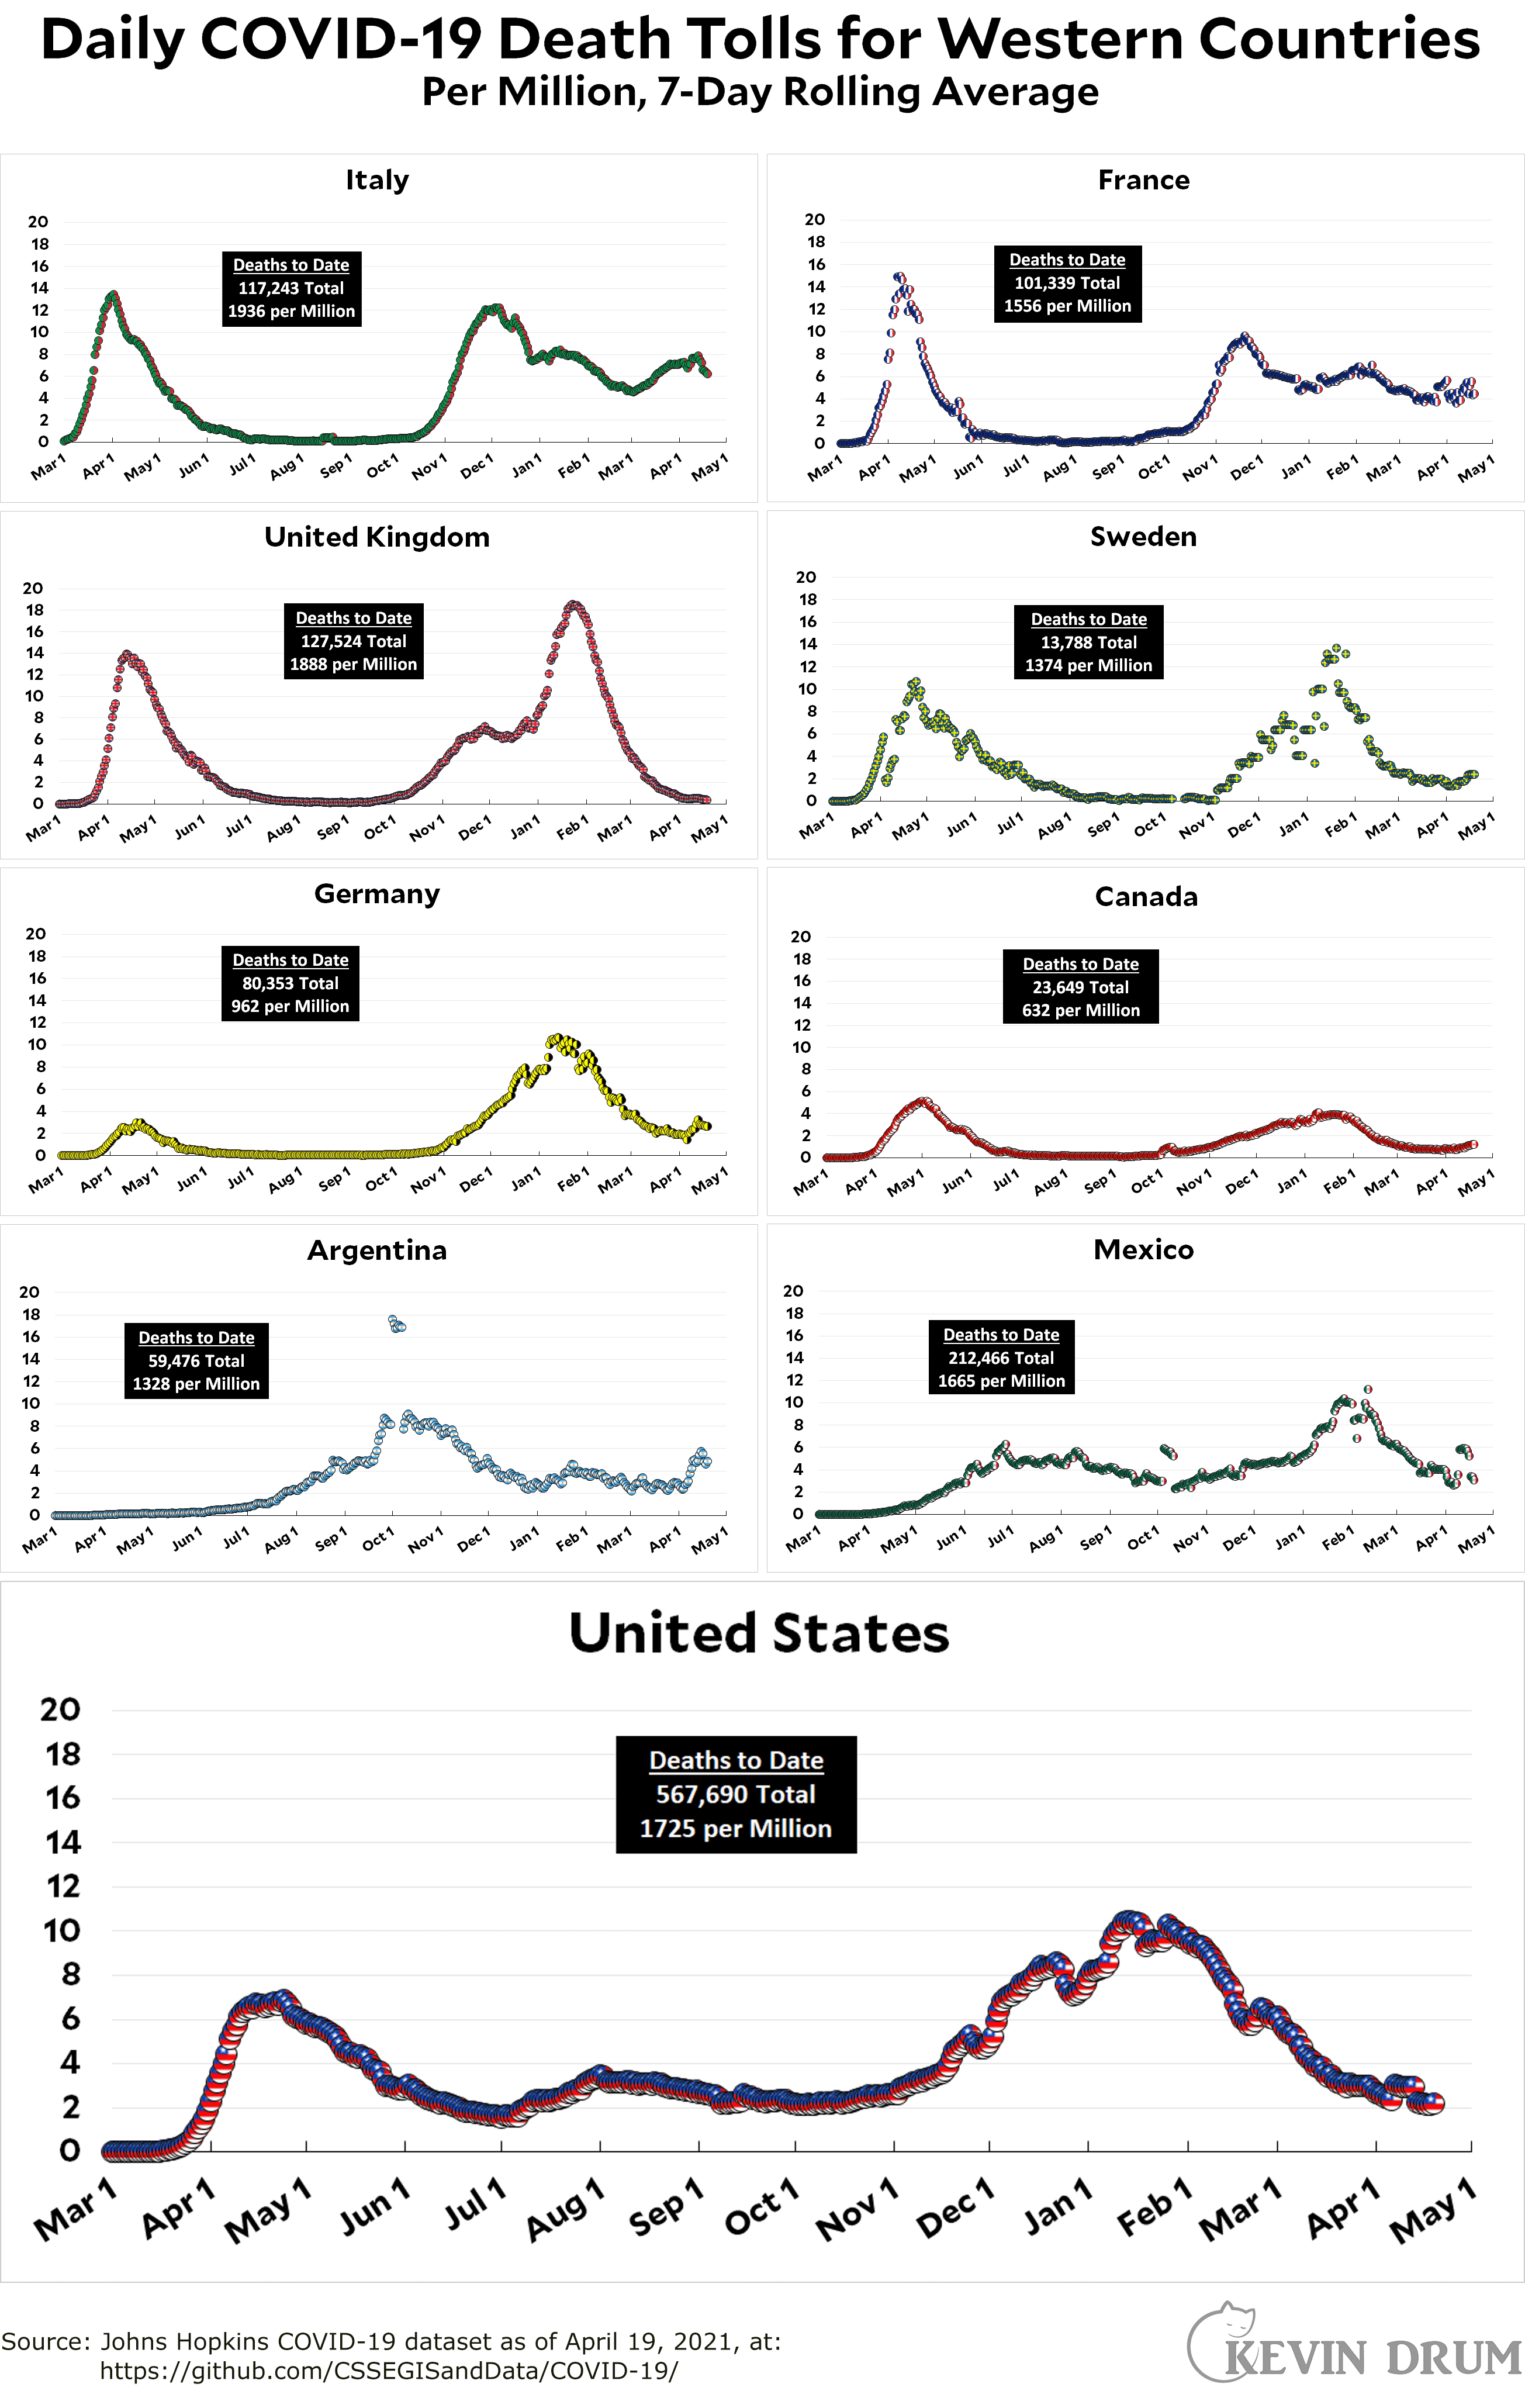
Here’s the officially reported coronavirus death toll through April 19. The raw data from Johns Hopkins is here.

Cats, charts, and politics

Here’s the officially reported coronavirus death toll through April 19. The raw data from Johns Hopkins is here.

Comments are closed.
Rank State Cumulative Deaths/million State Cumulative Deaths State 7-Day Trailing Deaths/Million/Day State Deaths/Day
1 New Jersey 2833 California 61045 Michigan 6.01 Michigan 62
2 New York 2654 New York 51627 New Jersey 4.26 New York 48
3 Massachusetts 2536 Texas 49618 Alaska 3.86 Florida 32
4 Rhode Island 2502 Florida 34471 Georgia 3.51 Tennessee 32
5 Mississippi 2403 Pennsylvania 25673 West Virginia 3.19 North Carolina 31
6 Arizona 2357 New Jersey 25161 New York 3.11 Georgia 26
7 Connecticut 2248 Illinois 23976 Delaware 3.08 Texas 23
8 Louisiana 2214 Georgia 19784 Pennsylvania 3.08 Illinois 21
9 South Dakota 2208 Ohio 18991 Montana 2.94 Connecticut 19
10 Alabama 2201 Michigan 17996 Kentucky 2.88 Massachusetts 19
11 Pennsylvania 2005 Massachusetts 17481 Florida 2.76 New Jersey 18
12 North Dakota 1981 Arizona 17153 Mississippi 2.74 South Carolina 16
13 Indiana 1965 Indiana 13226 Missouri 2.65 Virginia 14
14 New Mexico 1911 North Carolina 12418 Maryland 2.46 Washington 14
15 Illinois 1892 Tennessee 12081 District of Columbia 2.43 Maryland 12
16 Arkansas 1888 Alabama 10790 Connecticut 2.28 Louisiana 11
17 Iowa 1866 Virginia 10595 Alabama 2.27 Kentucky 9
18 Georgia 1863 Louisiana 10293 South Carolina 2.11 Pennsylvania 8
19 South Carolina 1816 South Carolina 9352 Idaho 2.08 California 7
20 Michigan 1802 Missouri 9010 Vermont 2.06 Minnesota 6
21 Tennessee 1769 Maryland 8574 California 1.99 New Mexico 6
22 Nevada 1743 Connecticut 8014 Puerto Rico 1.94 Puerto Rico 6
23 Texas 1711 Wisconsin 7421 New Mexico 1.91 Arkansas 5
24 Oklahoma 1692 Mississippi 7153 Texas 1.91 Idaho 5
25 Kansas 1686 Minnesota 7104 Illinois 1.88 Iowa 5
26 Delaware 1645 Oklahoma 6697 Virginia 1.82 Rhode Island 4
27 Ohio 1625 Kentucky 6347 Rhode Island 1.75 Nevada 3
28 Florida 1605 Colorado 6201 North Carolina 1.74 Colorado 2
29 West Virginia 1554 Iowa 5886 Maine 1.70 Indiana 2
30 District of Columbia 1553 Arkansas 5699 Minnesota 1.70 Kansas 2
31 California 1545 Washington 5394 Nevada 1.67 Maine 2
32 Montana 1447 Nevada 5368 Arkansas 1.61 Nebraska 2
33 Kentucky 1421 Kansas 4911 Louisiana 1.60 Utah 2
34 Maryland 1418 New Mexico 4007 Indiana 1.59 Missouri 1
35 Missouri 1360 West Virginia 2785 Massachusetts 1.55 Virgin Islands 1
36 Wisconsin 1275 Rhode Island 2651 North Dakota 1.50 Wisconsin 1
37 Minnesota 1260 Oregon 2460 Tennessee 1.38 Alabama 0
38 Virginia 1241 Nebraska 2215 New Hampshire 1.37 Alaska 0
39 Wyoming 1191 Puerto Rico 2213 Virgin Islands 1.33 American Samoa 0
40 North Carolina 1184 Utah 2166 Arizona 1.31 Arizona 0
41 Nebraska 1145 Idaho 2022 Iowa 1.31 Delaware 0
42 Idaho 1131 South Dakota 1953 Washington 1.22 District of Columbia 0
43 Colorado 1077 Delaware 1602 Kansas 1.18 Guam 0
44 New Hampshire 934 Montana 1546 Colorado 1.09 Hawaii 0
45 Guam 828 North Dakota 1510 Oklahoma 1.01 Mississippi 0
46 Washington 708 New Hampshire 1270 South Dakota 0.97 Montana 0
47 Utah 676 District of Columbia 1096 Wisconsin 0.93 New Hampshire 0
48 Puerto Rico 589 Maine 767 Oregon 0.64 North Dakota 0
49 Oregon 583 Wyoming 672 Wyoming 0.51 Northern Mariana Islands 0
50 Maine 571 Hawaii 474 Utah 0.31 Ohio 0
51 Alaska 451 Alaska 334 Hawaii 0.30 Oklahoma 0
52 Vermont 388 Vermont 242 Ohio 0.01 Oregon 0
53 Hawaii 335 Guam 136 American Samoa 0.00 South Dakota 0
54 Virgin Islands 252 Virgin Islands 27 Guam 0.00 Vermont 0
55 Northern Mariana Islands 36 Northern Mariana Islands 2 Northern Mariana Islands 0.00 West Virginia 0
56 American Samoa 0 American Samoa 0 Nebraska -0.44 Wyoming 0
I think the death count is no longer the best way to assess the progress of the epidemic. It used to be more reliable than other indicators. But vaccinations have changed overall mortality. And of course the large time lag inherent in death counts from disease has always made it unusable for decision making.
We see what happens only long after it happened.
I agree. If you watch the Swedish graph above, it seems there is a possible minor uptick recently, but generally it looks quite stable. But the number of positive tests have been skyrocketing lately, and hospitals are in deep trouble with very high number of patients, including ICU patients. Without close to 100% of the most vulnerable vaccinated it is clear that the Swedish graph would look very different today.
The Swedish authorities did from from early on consider the number of ICU patients to be the best indicator of how the pandemic progresses. At the same time, this measure has not been consistent throughout for various reasons such as doctors learning more about treatments, in particular effective treatment without the need of a ventilator, etc. Also, the fact that the British mutation has taken over almost completely seems to have changed the demographic of those admitted to hospital, with more young people hospitalized and in need of ICU than before, leading to a high ICU load even though the elderly are now protected.
CovidActNow seems to be running day behind...
MI dropped out of the extreme level (now less than 75 new cases/day/100K)--let's hope it holds
IL no longer in the red zone. Most red zone states seemed to have leveled off or are dropping, albeit slowly. FL still creeping up, and PR not doing well. MI, FL and PR all have hospitalizations and deaths going up.
In both MI and IL, smaller counties led the charge before the numbers in the cities took off. Detroit was then really hit hard, but rate is still below some smaller counties, though higher than the state. And the UP is clearing up a bit. Chicago is doing better than the state.
TN had a spike in cases--higher than "normal" post-weekend spike. Not sure why.