The year 2021 is half over. It's kind of hard to believe.
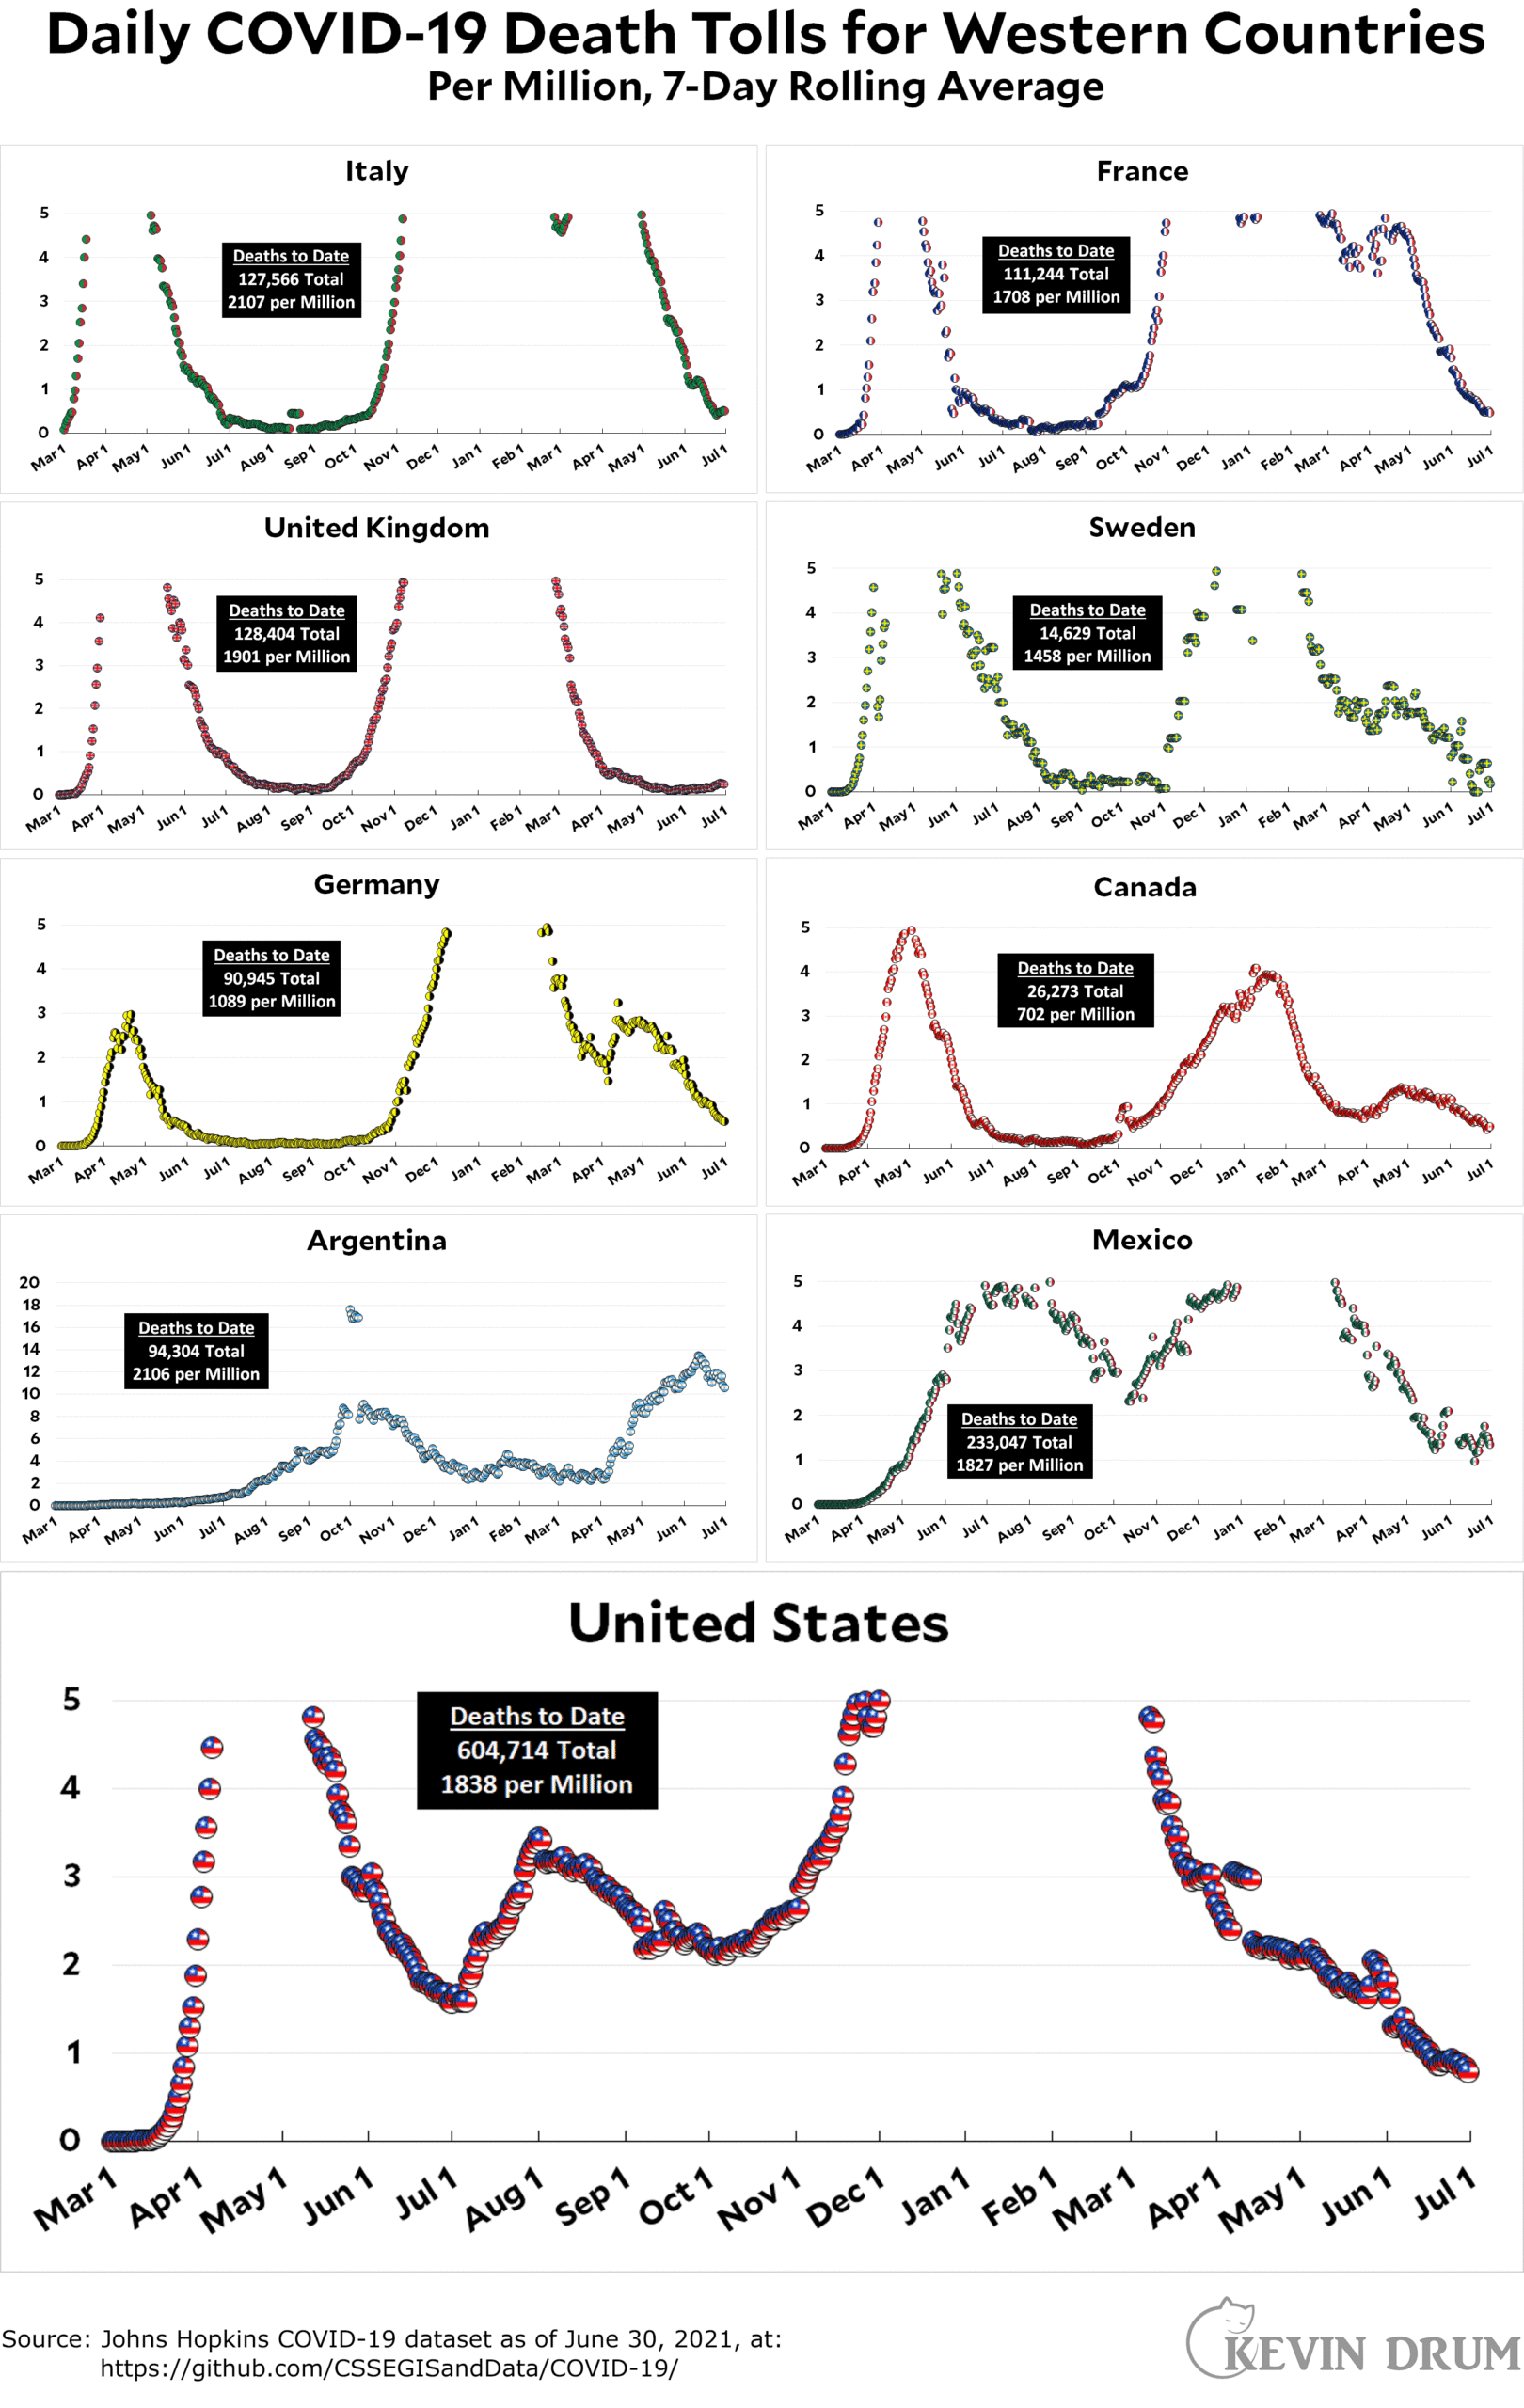
Here’s the officially reported coronavirus death toll through June 30. The raw data from Johns Hopkins is here.

Cats, charts, and politics

The year 2021 is half over. It's kind of hard to believe.
Here’s the officially reported coronavirus death toll through June 30. The raw data from Johns Hopkins is here.

Comments are closed.
Are you watching that growing geographic cluster of the newest wave of infections in MO, OK, AR, MS, and AL?
CovidActNow has 9 states under caution:
those about 10 new cases/day/100K:
state, cases, infection rate, % vax (first dose, total population)
NV 15.5 1.23 50%
MO 14.6 1.14 45%
AR 13.3 1.22 42%
WY 12.7 1.07 39%
UT 11.6 1.10 49%
and those with high infection rates:
MS 7.1 1.22 42%
NE 2.5 1.17 52%
OK 5.2 1.14 45%
KS 4.9 1.13 49%
with TX getting close:
TX 5.2 1.10 48%
Note with cases relatively low, a small outbreak can lead to a high infection rate, esp. in a small state. However, they need to be followed closely.
Looking at county map, hotspots are popping up in more locations, typically with lower vaccination rates, e.g. southern IL and few in GA
Yes. More reason for vaccine doubters to come around in those states. Meanwhile, keep those masks handy.
Pushing toward 67%. White's pushing toward 78% by next week.
Negro and Hispanic peoples?????