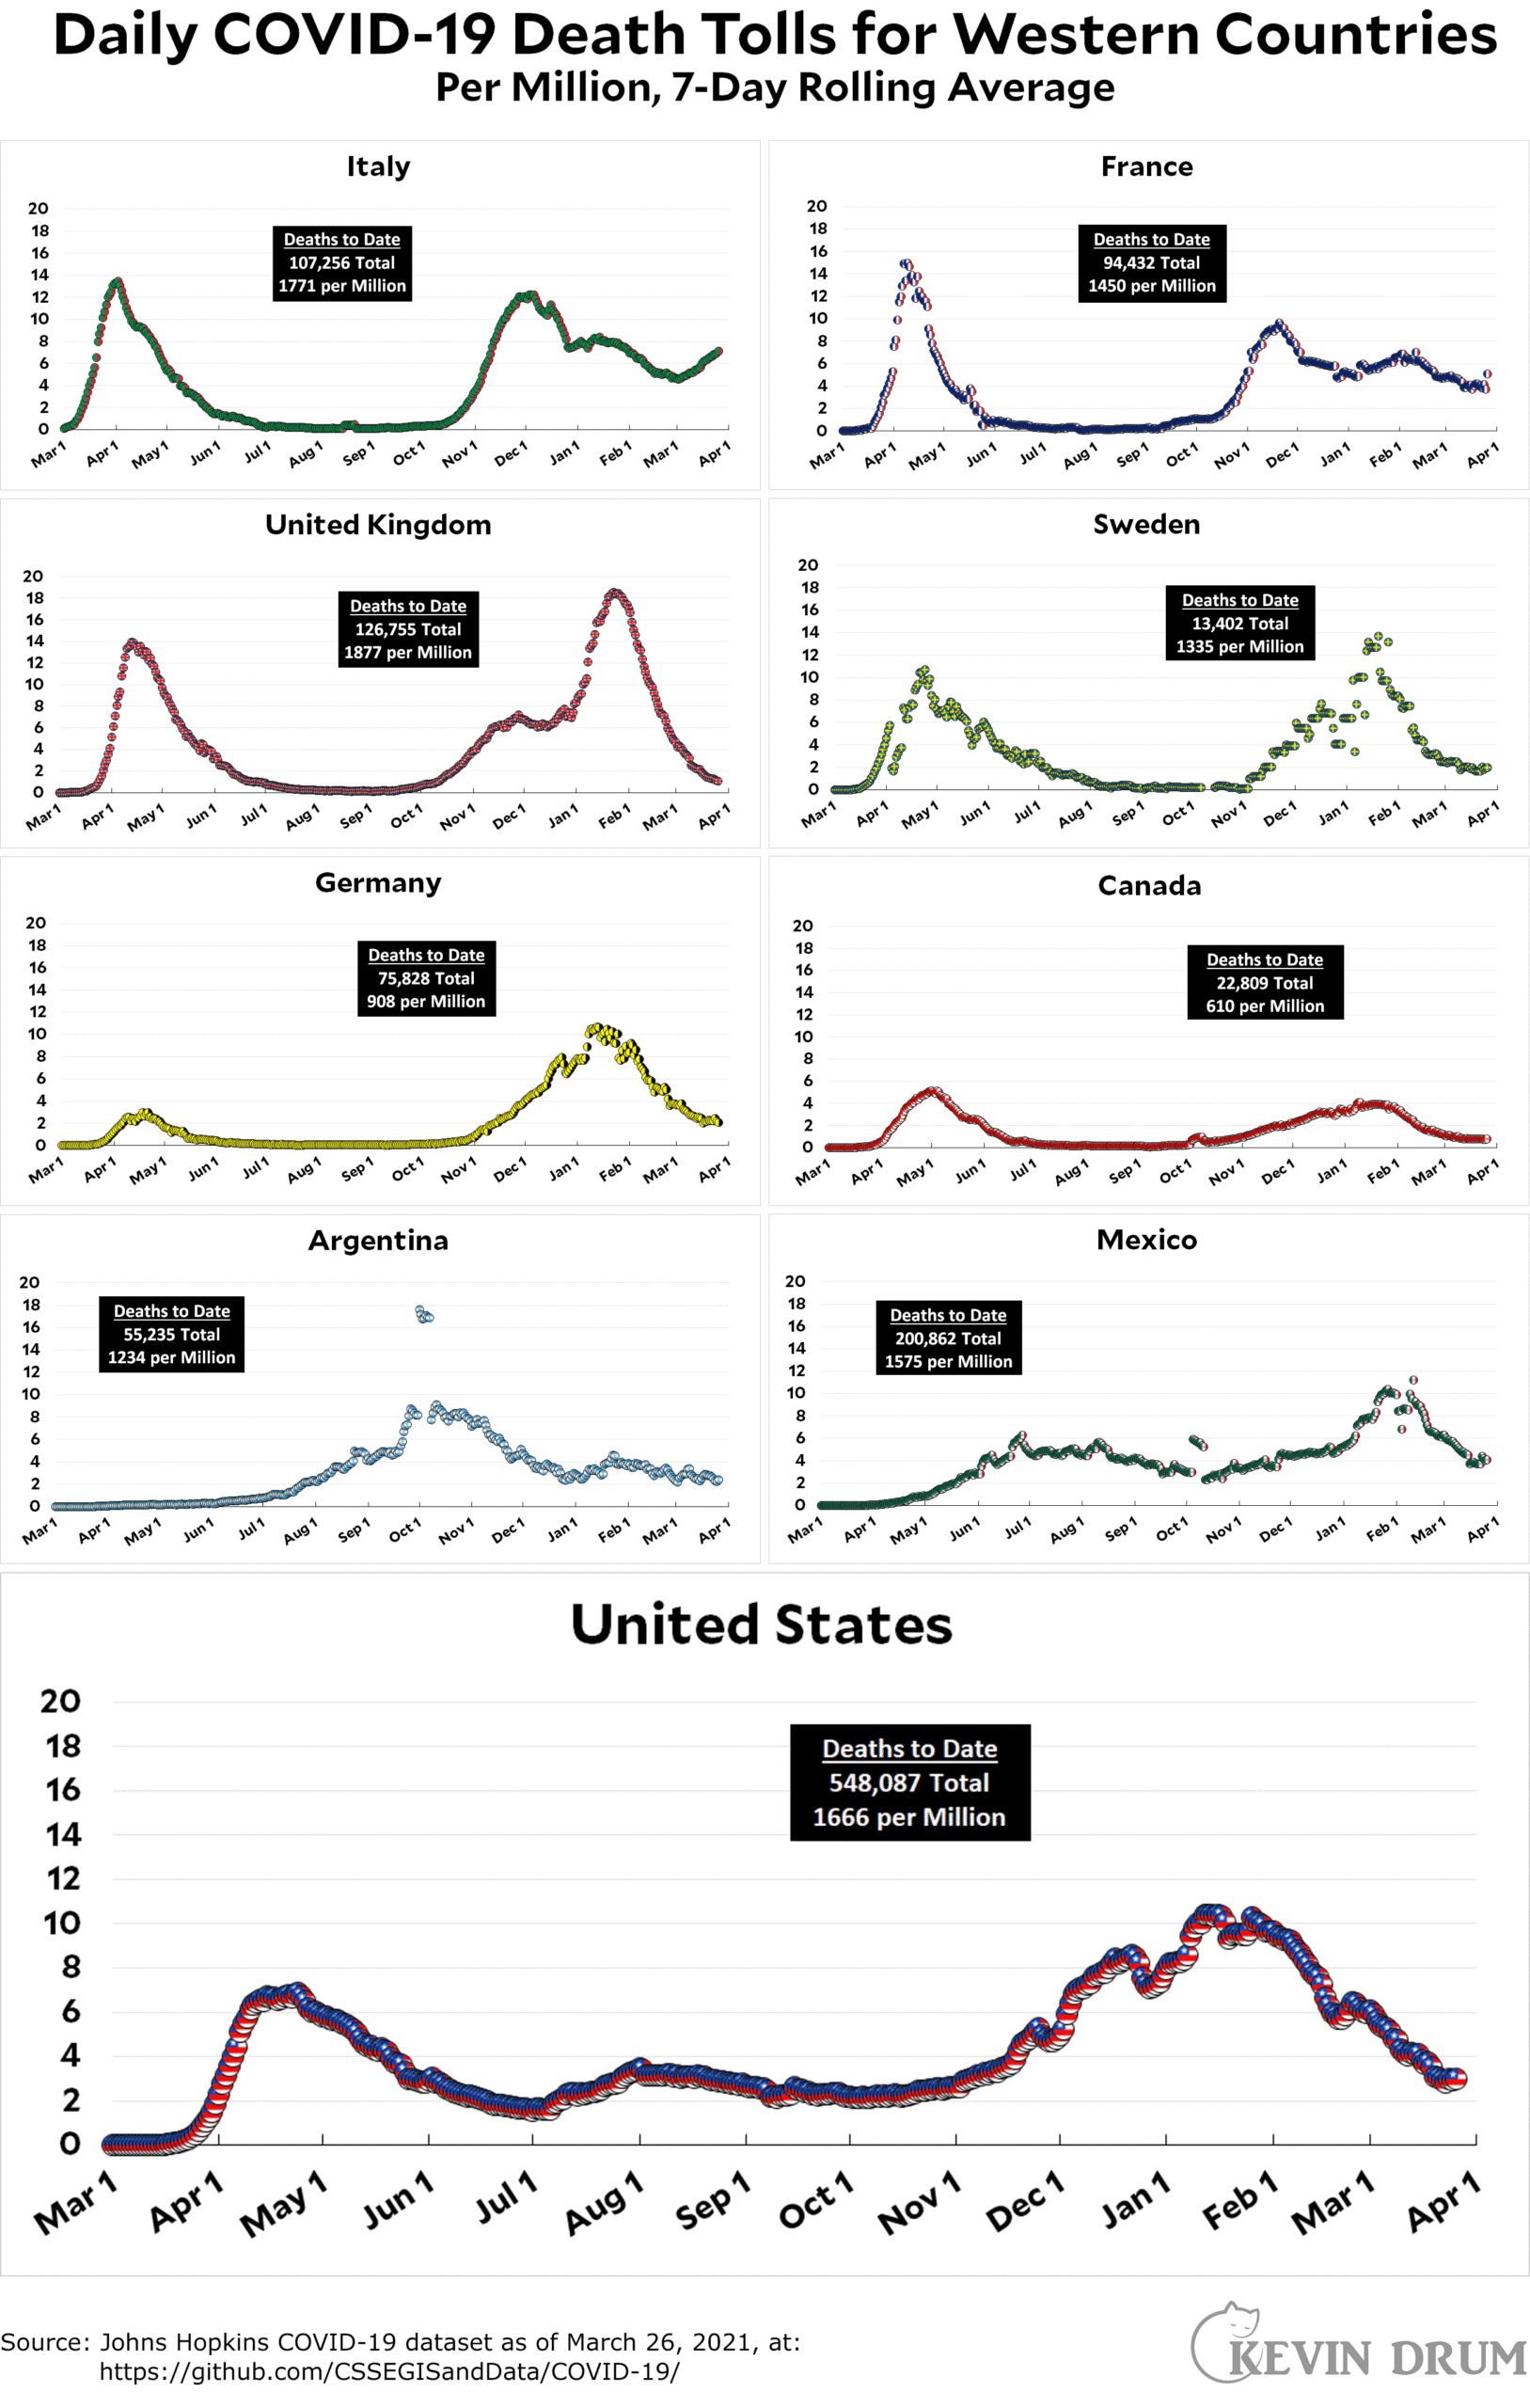
Here’s the officially reported coronavirus death toll through March 26. The raw data from Johns Hopkins is here.

Cats, charts, and politics

Here’s the officially reported coronavirus death toll through March 26. The raw data from Johns Hopkins is here.

Comments are closed.
We are beginning to see a divergence between daily new cases (rising) and daily new deaths (falling). This is partly due to the lag between infection and mortality. But it is also due to the fact that the rising infections are among unvaccinated younger people and the falling deaths are mostly among vaccinated older people.
https://www.wsj.com/articles/the-covid-19-vaccine-effort-is-protecting-older-people-growing-evidence-suggests-11616682522
We may (I emphasize the word "may") also be starting to see rising deaths in France and Germany, reflecting the rise in total cases that started a few weeks ago, and the lack of vaccines even among the most vulnerable.
I see little rise in deaths in Germany
The Maddow Show has a nice report on this:
https://www.msnbc.com/rachel-maddow/watch/covid-vaccinations-showing-great-success-variants-a-concern-for-unvaccinated-109180485623
Basically death rates amongst the elderly (65+), i.e. vaccinated, has collapsed. Not so much for the unvaccinated. However their reporting seems to have picked the values for the last day available, i.e. it's a slight artifact. The data is for the date of death, not date reported, the last week or so of numbers are a bit off.
Also, cases, hospitalization and deaths have all fallen about the same amount from their highs around Jan. Well, CovidActNow has the drop at 75%. The CDC also has the drop around 75% for cases, but 90% for deaths--using the end of Feb data so it's not in the "grey zone". Interesting.
It would make sense if case fatality rates were dropping, but are they? (Warning: numbers from my error-prone spreadsheets follow.)
For the United States, assuming a three-week lag between cases and deaths:
December 4 trailing seven-day total new cases: 3900 per million
December 25 trailing seven-day total new deaths: 51 per million
That's a death/case ratio of about 1.3%.
January 1 trailing seven-day cases: 4200
January 22 trailing seven-day deaths: 68
Death/case ratio of about 1.6%
February 5 trailing seven-day cases: 2670
February 26 trailing seven-day deaths: 42
Death/case ratio of about 1.6%.
March 5 trailing seven-day cases: 1300
March 26 trailing seven-day deaths: 20.4
The death/case ratio now is about 1.6%.
Now, I can think of ways to explain this, having to do with changes in who's getting tested and who's not getting tested, but just from these numbers, it looks like the population getting sick is still as old and in danger of dying as before vaccination had progressed very far.
This isn't great news at the moment, when case counts are clearly back on the rise in the U.S. The vaccine should be helping, but another burst of reopening is working in the virus's favor.
Reopening is irrelevant. Northern states are still using heat.
That does seem to be the case. There have been a number of "catch up" reporting states, e.g. WV, KY, etc., but I don't think that total is a large percent of current deaths. Not sure why CDC numbers seem low compared to CovidActNow or Worldometer (or Johns Hopkins?).
I do adjust for the catch-ups I know about. I did that for Kentucky and West Virginia in the past two weeks.
One thing I see in the CDC chart presented by Rachel Maddow is that they were using something called "earliest case date" on their x-axis, which distributes today's death reports back in time to be tallied on the date that case was first identified. A chart like that can't be complete at the right end of the time scale; the right end is always a big trail-off. (See Sweden's health department chart.)
VT has fallen....it's joined the over 25 new cases/day/100K club: NJ, MI, RI, CT, NY, MA, PA. Yes, NJ still staying ahead of MI.
MN and SD still working on becoming their own hotspot.
LA climbed out of the pool, leaving 10 of the lower 48 still enjoying the water, 10 new cases/day/100k or lower: CA, AR, AZ, KS, OR, AL, NV, OK,MS, NM plus NMI, HI and PR.
Big states: CA is doing alright drifting below 7, TX bouncing around 13, FL drifting up towards 23, NY doing poorly at 33, PA passing by 28 going up, and IL slowly rising past 16.
MN and SD barely have any movement. Lame posting
Not every post can be fire... ball whiskey, Shootie.