
Yesterday I wrote about the great financial results among car companies, and that remains true. However, I also put up a chart of domestically-produced autos and suggested that nothing all that serious had changed in 2021 despite endless reports of parts shortages.
But that was wrong. I looked only at automobile sales, which are a small part of domestic production these days. If you look at all light vehicle sales, it's pretty obvious that 2021 was something of a disaster:
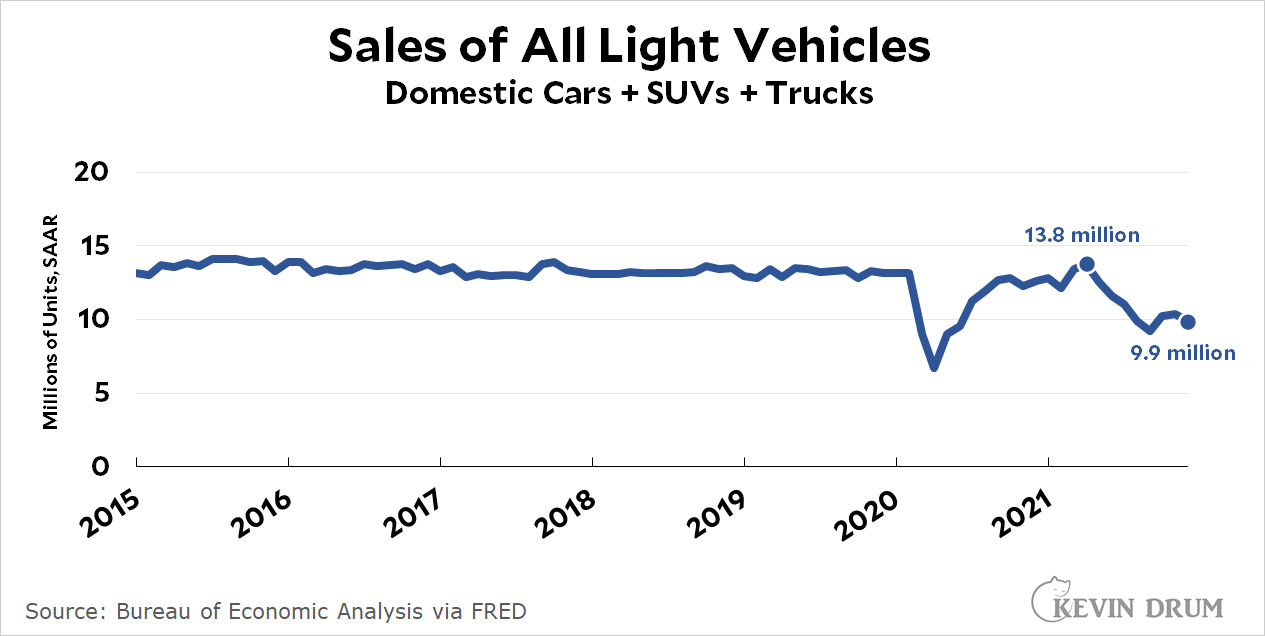 Sales of all light vehicles slumped by nearly 30% in 2021 thanks mostly to parts shortages. Apologies for the misleading chart yesterday.
Pingback: Wait: It turns out that car companies did fine in 2021 and imports were way up – Kevin Drum
Yes, in 2022 new car sales will surge as production recovers(which we saw in January), causing decreased demand in used car lots. Never chase lags.
We recently bought a late model used car -- got a good deal, no hassle, no wait. We also weren't particular about the color, exotic features, doo-dads, special tire rims and so on. Just wanted a good, solid car with a good warranty, low miles, and new tires and that's what we got.
I find this latest graph confusing.
The discussion is always focused on "sales per year," "profits per year," etc. On the graph, the first question mark in my mind is "what point on the graph x-axis, or what range on the graph x-axis, represents the year 2021?" Is it the distance from 2020 to 2021, or is it from 2021 to 2022, or is it half-and-half on both sides of 2021?
My other, and much more confusing, problem is "if things are measured by the year, what the heck is that squiggly line showing me?" It seems to me that when you represent parameters that are measured by the year, you would end up with a bar graph, not a squiggly line graph.
I think the line is showing a rate of sales not the total sales in a year. So if there were 1000,000 sales in a week it would show up as a rate of 5.2 million/year.
The point above the 2021 tick mark gives the value for January 2021, and points between "2021" and "2022" are for the other eleven months of 2021.
Each month's figure is the sales during that month expressed as an annual rate. Roughly, it's twelve times the number of sales for the month, but not exactly, because they figure in how many days are actually in the month.
In reply to Ken Rhodes, that is.
Thanx for the explanation. It makes sense, but it leaves us with a challenge:
To discover the annual sales figure, we need to integrate the area under the graph. Oh, well...
If you go to the graph at FRED:
https://fred.stlouisfed.org/series/ALTSALES
you can switch to yearly averages (EDIT GRAPH on the right)
Surely, the dealers can, and do, book the sales and the revenue at the time of ordering, even if delivery has to be pushed out a year or more? That is what every other business does.
In the business I work for, revenue is booked when the invoice is sent. In the construction industry, payment is sometimes painfully slow, but the no-pay rate is small. Booking revenue on a accrual basis is reasonably accurate, and reasonably representative of the business picture.
Booking it when the contract is signed would be foolish. Too many things can happen between the contract agreement and the actual performance of the work. And in automobile sales, that would be even more questionable.
And think of the tax implication. When you report your income to the IRS on an accrual basis, you pay tax on the income in the year it's booked. In our construction business that's not unreasonable--we've "earned the money" even if the payment is delayed. But in retail, you haven't earned the revenue when you took the order; you've earned it when you deliver, even if payment is delayed.
Like Ken said, no, they cannot mark undelivered sales as sales. It would be fraud. The non-delivery is a debt.
Obvious movie reference: Fargo.
"In the construction industry, payment is sometimes painfully slow, but the no-pay rate is small. "
Never done any work for the Trump Organization I take it. Smart move!
Sales slumped because production slumped. The amount of stock-on-hand dropped massively.
Demand is considerably higher than supply right now.
thanks for the update
Good call. When you said it, it had the ring of truth. Unfortunately no way to upvote you on that.