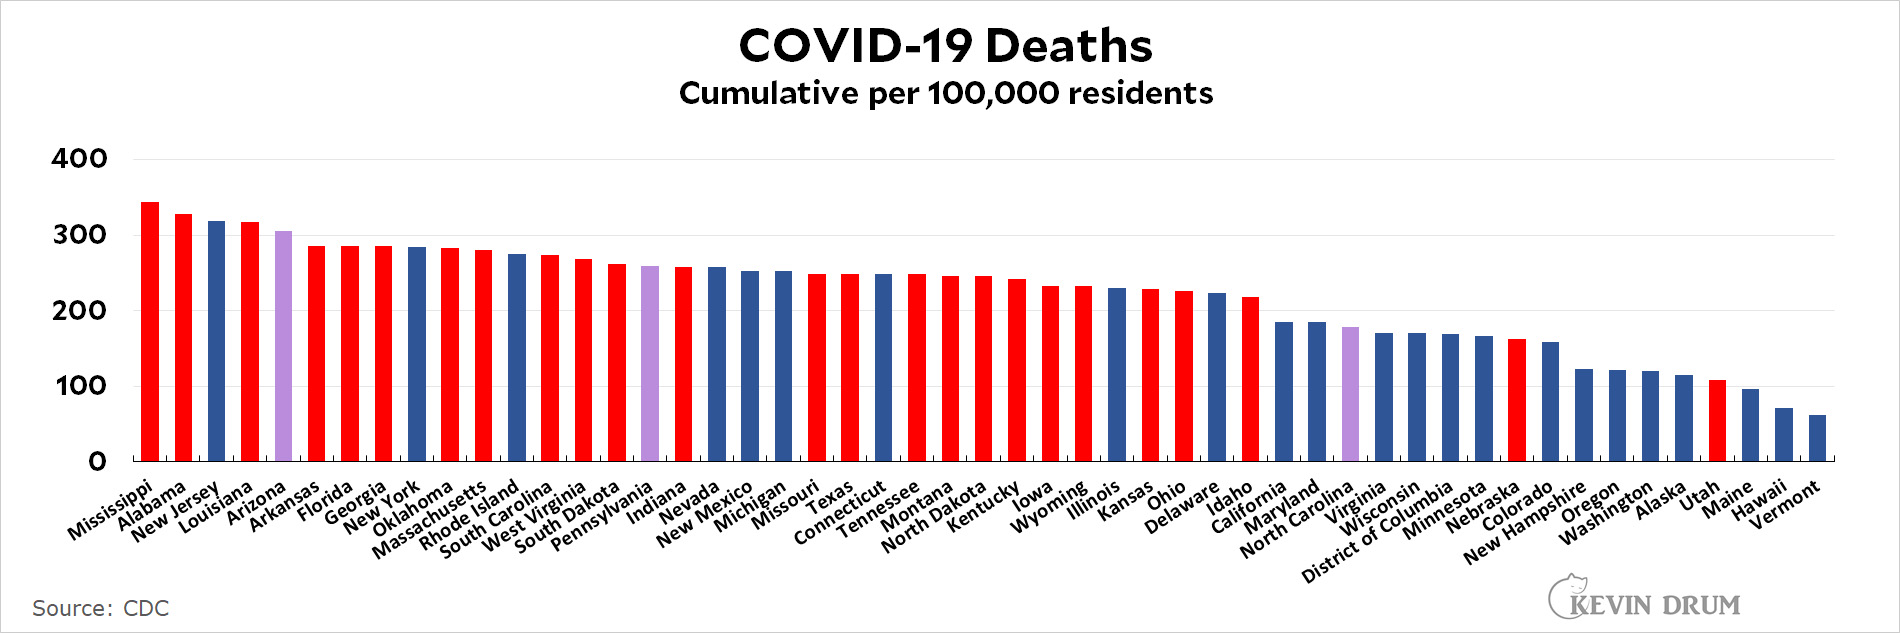
As long as we're at it, here are cumulative US COVID-19 deaths by state:
 Click on the chart to embiggen!
Cats, charts, and politics

As long as we're at it, here are cumulative US COVID-19 deaths by state:
Click on the chart to embiggen!
Comments are closed.
Covid has a color preference? Or is this another liberal fact thingy? Prolly won't be seeing this chart in any of the red state news outlets.
It has a stupidity preference.
Covid is an opportunistic virus that often becomes a secondary infection for those already stricken by the stupid virus.
Cringe.
He should make a scatter plot and do Trump margin of victory not this, then.
Also, try adjusting for obesity, which is an important comorbidity. (Also higher in red states) and then see how much the intervention policies mattered: not a lot.
Are we still the reality based community or are we just Blue Fox News?
I disagree. Lest you misunderstand, I agree with you on what has to be done if you want to disaggregate to find correlations. And don't think that is Kevin's intent.
The only thing Kevin's chart tells us about intervention policies is whose haven't been effective, which can be laxity, bad timing, or sheer damn luck.
For instance, being major ports of entry meant New York and California both got hit hard, early (really bad timing).
A state's politics isn't necessarily the strongest factor predicting its intervention policies. For instance, the southern states don't have mask mandates, but neither do the northeast states, while Utah and Idaho do. https://www.nashp.org/governors-prioritize-health-for-all/
What raises my curiosity is the outliers. I can guess at reasons for Utah's position -- lowest average age, lowest smoking rate, and (to my astonishment upon looking it up) on the low side for obesity.
At the other end, what is going on with New Jersey? Its obesity rate is 45th in the nation, so that particular comorbidity doesn't explain it.
Now do Washington.
Can you do a similar chart for European countries?
He did that yesterday. Check a few posts down.
Massachusetts is a red state?
Seems to be based on the party of the governor.
Doesn't look like it.
Indeed, if it were party of the Governor (which is what I use in my spreadsheet) there wouldn't be any Purple.
Wikipedia has 10 purple states, i.e. split governor/legislature.
Can't figure out what KD is doing...
As is tradition with KD and charts
Than what explains NH being labeled as blue? Not the gov. Not the "live free or die" conservatism. And from my sources working in hospitals there, their numbers are going to go up appreciably. They're swamped with covid cases.
Notice Nebraska and Utah. Education is the key. The Northeast is over educated. Even in rural areas. This leads to nerdy disease paranoia.
I would not trust the Nebraska numbers, as they've scaled back their reporting. See https://apnews.com/article/health-coronavirus-pandemic-nebraska-b603f55c06fb6bdeb92355fab722a126
Couldn't Warren Buffett hit up his fellow cosmopolitan George for some ( ( ( Soros Bucks ) ) ) with which to bribe Cornhuskers to get vaxxx'd.
Lol, then I don't trust New York state's figures.
Shifting to a per 100,000? Everything used to be per-million.
How is Red/Blue/Purple arrived at for a given state?
The word bimodal has come to mind for some reason.
I object to Wisconsin being labeled as a blue state. At best, it’s purple.
Take a long time to do it, but a state-by-state, county-by-county graph--with red and blue indicators would tell a more precise tale, even if it's one we can already guess.
Massachusetts a red state? NC purple?
The red/blue/purple thing is really confusing. Perhaps Kevin can explain how the colors are determined?
Seems to be his idea of which states are Dem, Repub or Swing/Mixed.
So red state governors that just basically let Covid take its course w/o any significant lockdowns or mask mandates keep saying, sure we may have had more fatalities, but the important thing was keeping the economy open and maintaining freedumb. So let's take a look at two states with similar populations and demographic profiles (small, rural, very white) but two very different approaches: Vermont vs. South Dakota. In Q1 2021, SD had economic growth averaging 6.4% with an unemployment rate of 2.8% Not bad! Sure those numbers are perched on a pile of corpses, but eggs, omelettes, and so on, amirite? Vermont has a non-insane Republican governor who imposed common-sense restrictions at the height of the pandemic and helped Vermont become the best-vaccinated state in the country. He must have tanked his state's economy to do that, right? Q1 growth: 6.1%. Unemployment, 2.6%. Oh well.
Someone else can do Texas versus California or whatever, but you get the idea. (Trumpy) Republican states kill their citizens for no good reason. Pass it on.
I'm a little confused by the colors as well. While most Republian-governed states (Utah seems to be an outlier) were Covid clusterfucks, remember there were a couple of level-headed Republican governors in the northeast who did a decent job responding to the pandemic, including in Vermont, Maryland, and Massachussetts. Mike DeWine in Ohio tried to be sane at the outset, but ended up being thwarted at every turn by his Trumpy state legislature.
It's not a partisan map, but seems to be an ideological map. For example Georgia (where Biden won and has 2 Dem Senators) is Red because it's still a very conservative State. Meanwhile North Carolina is Purple, because despite the fact that Biden lost and it has 2 R Senators, it's still a moderate State, and New Hampshire is Blue, despite having a R Governor, because it generally is more liberal than say, North Carolina.
Oops. You have Alaska shown as a blue state. So ... the whole thing must be wrong! Gotcha!
This chart needs to be revised to eliminate the impact from first wave beginning in March 2020, when the country, especially the northeast (NY, MA, NJ) was hit with millions of people returning from Europe (Italy, Spain, ect), and mostly coming home though JFK, EWR, and BOS with a new pandemic causing virus that we knew so little about and was mostly unprepared to deal with. How the states performed after the initial wave is more relevant in terms of how mitigation strategies (or lack of them) impacted mortality. We should also compare mortality rates after vaccines became available.
Agreed. See below.
I won't try to figure out the vagaries of red, blue and purple states, but if you look at cumulative deaths per 100K since we've had ample time for vaccines and some help with monoclonal antibodies (I chose May 1 2021 as a date by which there was ample chance for vaccination), then you get a sense of how the states' population and leadership has protected themselves recently:
Here are the top 12 states:
WV 129
FL 119
WY 111
ID 105
MO 104
MT 100
MS 99
AL 98
GA 97
AK 97
LA 95
SC 92
Here are the bottom 12:
UT 40
IL 40
MN 40
HI 37
CA 33
NJ 31
MD 31
NH 29
MA 25
VT 24
RI 23
CT 22
Some might say this is cherry-picking, but I think the question of how we have held up during the mostly Delta variant surge when we have had good tools to combat this pandemic is a reasonable one to look at. There will be more deaths in the coming winter, and probably a smaller surge in the South than the north, so the gap will likely narrow. But in terms of "what have you done for me lately," you get the picture. This is CDC data, May 1 to November 29.
For completeness sake, here are deaths per 100K in the middle 26 states since May 1. I goofed on the above abbreviation for Arkansas 97 (not Alaska).
NV 82
KY 81
TX 78
TN 70
AK 69
AZ 67
NM 66
OH 62
OR 62
MI 61
IN 61
KS 58
DE 56
PA 55
NC 53
ND 52
NY 51
WA 50
CO 50
OK 50
NE 47
VA 46
IA 44
WI 41
SD 41
ME 40
I suspect coding MA as red is just a mistake. Since NY, NJ, MA and CT were all hit hard by the virus early, before we had adequate testing and when every state was late in shutting down, a more telling graph might be from June 2020 till today.
Much of this is a tragedy. Sometimes, it is cosmic justice.
Marcus Lamb, the founder and president of the controversial, conservative outlet Daystar Television Network, has died after a battle with COVID-19, his network and family announced on Tuesday. He was 64.
When Obama killed bin Laden, we all cheered. Lamb was a terrorist too. Good riddance.
1980s Doctor Who villain Omicron appears in California,
https://www.livescience.com/first-omicron-case-us-confirmed-california