
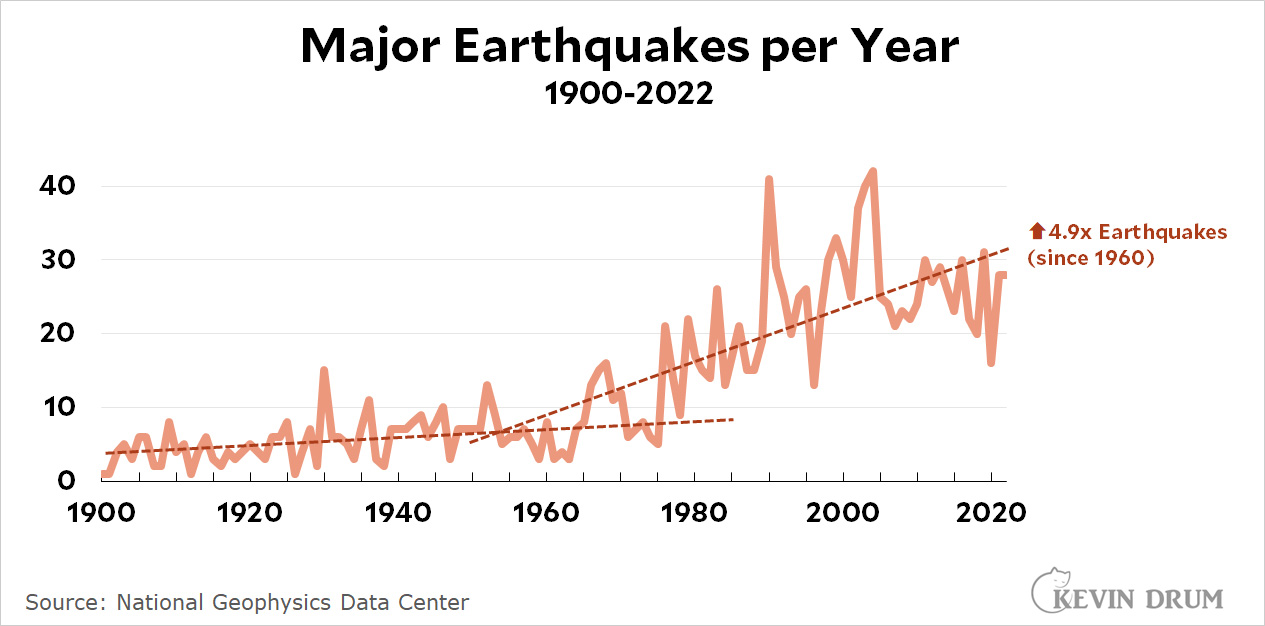
Why are there so many more earthquakes than there used to be? My friend the geophysicist answers:
Before 1960 there was only a minimal global network of seismometers, and it was difficult to share data among researchers. After the 1963 Test-Ban Treaty in which the USA and the USSR agreed to cease detonating nuclear devices above ground, the US developed a unified technology for analog seismic stations and installed a global network to monitor underground nuclear explosions at the Soviet test sites and the possible underground nuclear detonations by other nations.
This network, the WWSSN, The World Wide Standardized Seismic Network, could be accessed by any academic researcher to study global seismic activity. It is not surprising that the number of "major earthquakes" detected globally went up significantly soon after the network began operation.
The second boost to event detection began with the advent of global digital seismic networks from which digital data could be fed directly from a sensor network into a computer to search for unnoticed events. The stated goal was to detect a 1-kiloton underground explosion anywhere on Earth, roughly Richter magnitude 4. The 1960s WWSSN had focused on Eurasia, so it missed many "major" earthquakes in other parts of the world. Many major quakes occur in remote regions, such as the Tonga Islands or Vanuatu Islands. Before 1960, only the largest quakes in these remote regions were detected and cataloged, and M=5 quakes were routinely missed by the WWSSN.
Because the post-1960 increase was in "major" earthquakes, I figured it was unlikely to be merely a measurement issue. I guess I was wrong.
Fallout from the atomic age, then? That would put the blame on Openheimer, or as Lewis Strauss calls him in the movie: "The man who moved the earth."
It's so unusual to have someone correct their misunderstandings or errors. Good on you.
Hmm... Judging from the numbers the definition of "major" quakes looks to be M7 or larger. That's a pretty big quake. Is that the definition used for your chart?
Thought something along those general lines would explain it, so thanks for the detailed explanation. At least one reply in the earlier thread seemed to indicate there might be longer-term patterns in when they occur, and these several decades of instrumented records are a start in tracking that possibility.
Was the digital network completed mid-2000s?
Off topic but Kevin’s post about “Some slaves really did earn money from skills they developed” (https://jabberwocking.com/some-american-slaves-really-did-earn-money-from-skills-they-developed/) so DeSantis’ Florida really isn’t racist isn’t aging well at all. Latest is school districts rounding up all the black kids in special assemblies to tell them “you’re The Problem… pass this test or end up dead or in jail.” Even the ones who *did* pass the test have to apparently be publicly shamed in front of their non-black peers. (I’m sure the rest of kids eventually heard why all the black kids vanished for an hour.)
https://www.washingtonpost.com/education/2023/08/23/florida-black-students-assembly-test-scores/
The beatings will continue until test scores improve. But as long as we don’t use the N-word, comfortable “liberals” in Orange County will come up with reasons why DeSantis isn’t turning Florida into a modern-day confederate state.
Kevin likes to debunk various media reports, often involving science, and he is often right. But he is unduly credulous about increasing frequencies of events due to global warming. This is a difficult subject statistically and there are major problems with getting accurate measures of these things from other than the most recent events, as in the case of earthquakes. Reports are often highly biased in favor of sensationalism (that's how the popular media work). Regarding things like destructive floods and wildfires, part of the reason for increase in frequency (aside from incomplete historical coverage) is that increasing population causes people to move into flood- or wildfire-prone areas.
I don't think the trend lines in Kevin's previous post, not just the earthquakes, mean much. This subject is best left to experts, but what gets into the media is often not really good work by experts. Good for Kevin for correcting himself on earthquakes but the other trends need to be looked at similarly.
Yes.
It is further a lesson for all subjects where there is a technical specificity to the data and statistical analysis, including econometric.
Drum has a further tendency across all subjects to be a bit to credulous that the statistics he has on hand are objective black-and-white numbers that doing a direct analysis with a rather strong lens to looking to monocausality.
Still not enough people go to the numbers and the stastics, so despite his blindspots it is refreshing to have someone at least focusing on the statistics and drawing attention rather than doing the rather worse practice of Anectdote as bad stand-in for data to tell a story.
Earthquakes are measured on a log scale, so a 5 is nothing compared to a 6. And if your earthquake is in an unmonitored area that contains no cities, I can see how many would be missed in the past. A 5.0 below a rural village might make some mess, but the locals can clean it up fast and it wouldn't ever make the news in the city.
Apparently Drum doesn't read the comments, because he was asked about the source for his data and hasn't responded. The graph lists the source as the National Geophysics Data Center, but as far as I can tell the NGDC doesn't track “major earthquakes.” It does track “significant earthquakes”
Drum's graph isn't a graph of “significant earthquakes” because the numbers don't match. So if his numbers come from this database, they must be the result of searching this database using search criteria to select “major earthquakes.” Many records in the database have fields that don't contain values, so depending on the search criteria used, the results could be biased towards more recent earthquakes where more information is known.