Skip to content

In FY22, the budget authority for federal discretionary spending was $1.788 trillion. Actual discretionary spending came in at $1.664 trillion. But the House Freedom Caucus has long been stuck on a figure of $1.471 trillion as "real" FY22 spending, and they want the budget for next year (FY24) to match that.

This makes no sense since it doesn't even account for inflation, but put that aside. I've been wondering forever where this number comes from. It simply doesn't match anything that I've ever been able to dig up. Today, though, I might finally have figured it out thanks to the Heritage Foundation. Apparently it's the pre-COVID trendline extended out to 2024:

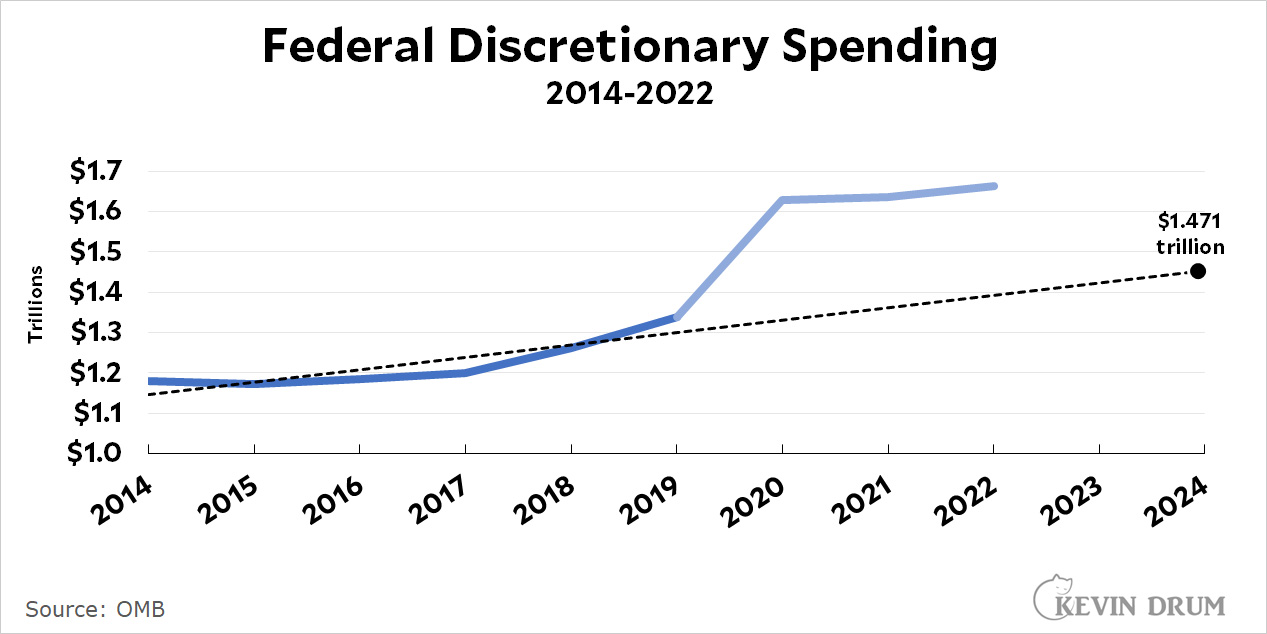
The Heritage number is about 1% higher than my trendline, probably due to slightly different assumptions, but never mind that. It's close enough to suggest that Heritage has this right. The Freedom Caucus number is just a trendline extended from one arbitrary point to another.

Here's the same chart but adjusted for inflation:

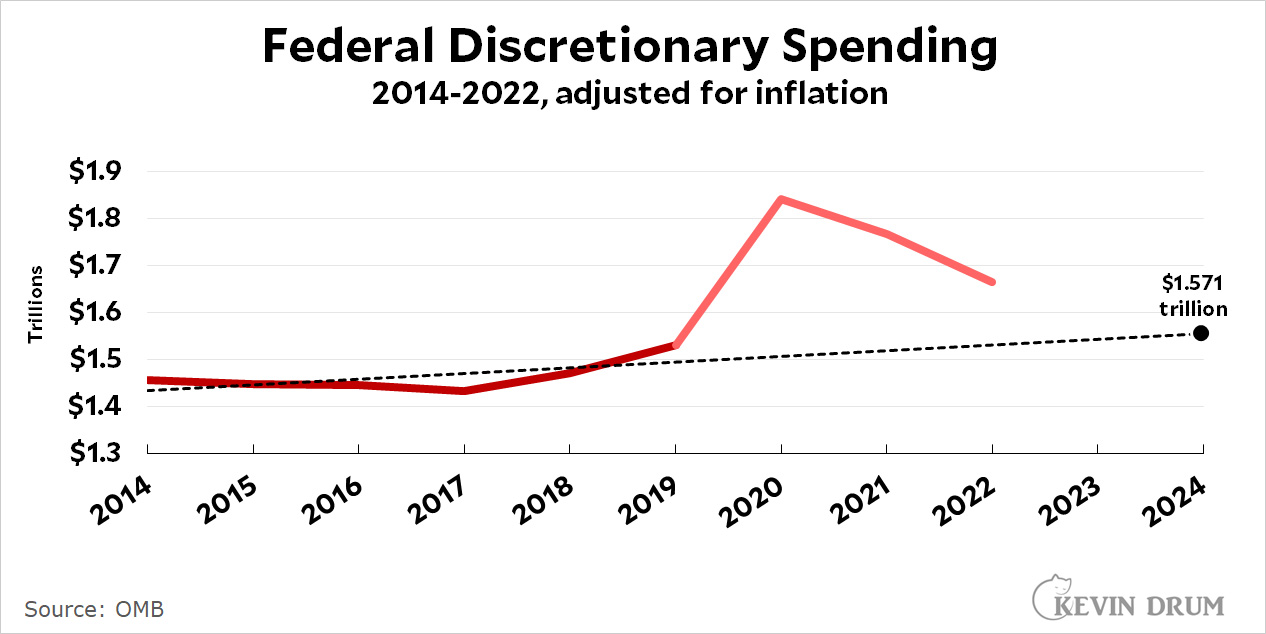
This produces almost precisely the topline number in the bipartisan Senate spending bill, which is based on the number agreed to during the debt ceiling negotiations. And while there's no special reason to use this trendline at all, if you're going to do it you at least need to adjust for inflation.

Anyway, I just wanted to share this since it's been bugging me for a while. The Freedom Caucus number is neither the "FY22 number" nor the "real FY22 number." In fact, it has nothing at all to do with FY22. It's apparently just a made-up number from drawing a trendline.

If anyone happens to have a different story about where the Freedom Caucus number came from, let me know in comments.

Housing units under construction stayed about the same in August—a combination of fewer single-family homes but more apartments. However, the construction rates for both are still above their pre-pandemic trends, as is the overall construction rate:

As housing prices rose, builders increased their construction rate. That makes sense. But with construction rates above trend for more than two years you'd think prices would be coming down. And they are! But not by much:

Rent is down 2% from its peak and home prices are down 4%. Both are up 20% from their pre-pandemic level.

The LA Times writes today about California's declining population:

In the last few years, it ground to halt and then dropped — and all the while developers continued to build. Given the laws of supply and demand, one might think fewer people and more homes would equal lower prices. But California housing costs remain stubbornly high and have barely fallen — if at all.

So why have housing prices stayed so stubbornly high? In fact, getting higher even though California's ratio of housing supply to population has gone up every year since 2016:

This explains why California home prices are high: California's housing ratio may be up, but we would still need 2.2 million more housing units to catch up with the national rate. This hasn't changed since 2010.

But it doesn't explain why housing prices are increasing. After all, housing supply relative to population has gone up since 2016, both in California and nationally, and yet even after adjusting for inflation asking rents are 20% higher and home prices are 30% higher nationwide—and probably up about the same in California. It is indeed a bit of a mystery.

POSTSCRIPT: The Times suggests that California's population of millennials is shooting up, and since this is the prime age group for entering the rental market and buying a starter home, it's driven prices up. But it ain't so. The 20-34 age group has increased about 3% since 2010 and the 35-49 age group has stayed exactly the same. This compares to overall population growth of 5%. California is aging, not producing a bulge of millennials.

I know that these just-so stories about population are easy to believe, but I sure wish reporters would do a smidgen of basic research before passing them along uncritically.

The New York Times ventured out to the UAW picket line over the weekend in order to figure out why so many union workers don't think very highly of Joe Biden. Most of it was just the usual blather, but for some reason my curiosity was piqued by a guy who works at the Jeep plant in Toledo, Ohio:

“In 2018, I felt like I had finally gotten ahead,” Mr. Luvinski, 52, a Trump supporter, said. “I finally had money in my bank account. And now, I make more money than ever, and I have less. My energy bill just doubled in June.

My initial reaction was that this was probably just the usual innumerate BS from someone who wildly overestimates the rate of inflation. But no. It turns out that electricity rates in Toledo really did double on June 1st.

The reason is that electricity prices in Ohio are set every June based on auction prices from the previous year—and auction clearing rates last year were unusually high. But why? Neither oil prices nor natural gas prices were especially elevated when the auctions were held. The best explanation I could find was from Brakey Energy, "Ohio's energy experts," which provided this caustic summary:

Power wholesalers operating in Ohio have a long history of lurching between fear and greed-based market decisions. These wholesalers were too greedy and underpriced risk in the current delivery year’s SSO auctions, as their predicament [i.e., big losses] clearly illustrates. In Brakey Energy’s opinion, power wholesalers have now run to the other side of the boat and are being too conservative in how they are bidding into SSO auctions.

In other words, power wholesalers underpriced electricity and lost money two years ago, so they overpriced last year to make up for it. Since last year's wholesale prices determine this year's residential price, the cost of electricity doubled in June.

Needless to say, this has exactly nothing to do with either Joe Biden or our recent bout of inflation. Nor is that much of a secret. Ohio's pricing regime was put in place 15 years ago, and ever since the power auction held last November news outlets in Toledo have been warning that rates would spike on June 1st. But none of that matters. Electricity prices are way up and that makes people frustrated. When people are frustrated they decide the country is headed in the "wrong direction." And when the country is headed in the wrong direction the obvious person to blame is the current occupant of the White House.

And that's Joe Biden.

Here are the number of workers who have gone on strike during each month since the start of 2000 through August of 2023:

Generally speaking, years with a lot of workers on strike include one or two big strikes, not a whole bunch of smaller ones. A variety of industries are involved when you look at things from this perspective, which counts workers no matter how long the strike is. Things are different when you look at the number of workdays lost to strikes:

Now it's all about the actors. Since 2000, the only months with more than 2 million workdays lost are those with strikes from the actors guild. The teacher strikes in particular look much smaller than before because they were very short.

Nickel summary: There's nothing very unusual about 2023 except that we're having another strike by actors. The numbers will spike up a bit in September thanks to the UAW strike.

POSTSCRIPT: In case you're curious, here's how 2023 looks without the actors strike:

The small bump remaining is nearly all due to the writers strike. Aside from Hollywood, 2023 has been a very normal, low-strike year.

I was out in the desert on Saturday night on my third attempt to photograph the Wizard Nebula, aka NGC 7380, an emission nebula in the constellation of Cepheus. On the first attempt my battery pack ran out of juice and I only got two hours of exposures. The second time I had a complete system meltdown that turned out to be caused by the failure of a $10 USB hub. Finally, on the third try everything was perfect. The sky was dark and bright; the equipment worked flawlessly; and I got about six hours of exposures.

The only problem is that the picture I ended up with was terrible. I'm at a loss to figure out what happened. The stars are all sharp and round, which means everything worked well, but the nebula itself is vague and lacks almost all detail. To make things even more inexplicable, the picture was worse than my first try where I got only two hours of exposure time. Maybe I overexposed the individual frames?

Here are both of the pictures. The top one is from Saturday. The bottom one is from a month ago. For a good amateur picture of the nebula, click here.

September 16, 2023 — Desert Center, California
August 24, 2023 — Desert Center, California

Donald Trump appeared on Meet the Press yesterday to deliver his usual word salad and outright lies on a variety of subjects. Here are some excerpts from his musings on abortion:

five months, six months, seven months, eight months, nine months

five, six, seven, eight, nine months

four and five and six months.

you're going to come up with a number of weeks or months

people are starting to think of 15 weeks

DeSanctus is willing to sign a five-week and six-week ban

six months, seven months, eight months

a number of weeks or months or however you want to define it

the number of weeks is much more important

something will happen with the number of weeks

Mike Pence said something about 15 weeks too

now all of a sudden he's saying 15 weeks

It's going to be a number of weeks

There is a number, and there’s a number that's going to be agreed to

you will win on this issue when you come up with the right number of weeks

the seventh month or the ninth month or after birth

Trump is obsessed with the notion that he can get the whole country together on abortion by choosing just the right number of weeks when it becomes illegal. Needless to say, there are a limited number of choices here, from 0 to 39, nearly all of which have been discussed at one point or another. And guess what? There's no agreement!

Trump is obviously just bullshitting here, but there's still an interesting question to ask: Will he influence the abortion debate among conservatives? That is, if he zeroes in on 15 weeks as the magic number, will conservatives stand their ground or will they moderate their views out of loyalty to Trump?

It could go either way. On the one hand, Republicans have shown a remarkable willingness to follow Trump's about-face on previously long-held views—Social Security, Medicare, free trade, and so forth. On the other hand, Trump's power is not unlimited: when he tried to get his fans to support vaccines they booed him off the stage. I suspect that will be the case on abortion too. The closer Trump gets to proposing a hard number, the more opposition he's going to get from his own base. He's eventually going to have to back down, I think, at which point he'll pretend that he's always said life begins at conception and he's said it very strongly. We'll see.

Sometimes I like to highlight deceitful charts. Other times I highlight misleading ones. It's rare to find a chart that's completely useless, but that's what the Wall Street Journal has on its front page today:

What is this even supposed to mean? How can you interpret it unless you know what percentage of jobs come from the government in the first place? And why does it include data from ZipRecruiter when it's all available from the BLS?

The point of the piece is that government hiring is growing faster than private hiring so far in 2023, which isn't even really true—there was a tiny jump in government hiring in January, but growth since then has been 0.9% for both. In any case, why not just use a simple chart like this in the first place?

It's pretty easy to see that, generally, government growth has been slower than private-sector growth. If you go back and compare to the last month before the pandemic, the difference is pretty substantial. Government employment went down and has never come close to catching up.¹

Of course, tracking government employees is almost pointless anyway since so much government work is done by contractors. Even growth is hard to measure since you have to know how much is actual growth and how much is simply the result of firing contractors and giving their jobs to government workers. Good luck trying to figure that out.

¹In fairness, the Journal article does mention this. But only barely.

Atrios today:

Calling those programs "AI" is only slightly less stupid than thinking a link to an ape.jpg is worth millions. I think it's losing — by giving it too much credibility — to get into arguments about why it isn't in any sense "artificial intelligence." But it isn't! Everyone knows it isn't!

It's funny that he mentions this. I've been fruitlessly making the same point for years in the face of overwhelming marketing campaigns that insist every product is "powered by AI" or some other nonsense. But even the most advanced examples of smart computers—Watson, Deep Blue, etc.—aren't artificial intelligence or anything close to it.

But last year I finally gave up. The onslaught of ChatGPT, and the admittedly amazing things it could do, led to a universal belief that it was AI. At some point, you just can't turn back the tide. So fine. It's AI.

But it's not. Even if you have an expansive definition of AI, ChatGPT isn't. It's just another step along the way.