Skip to content

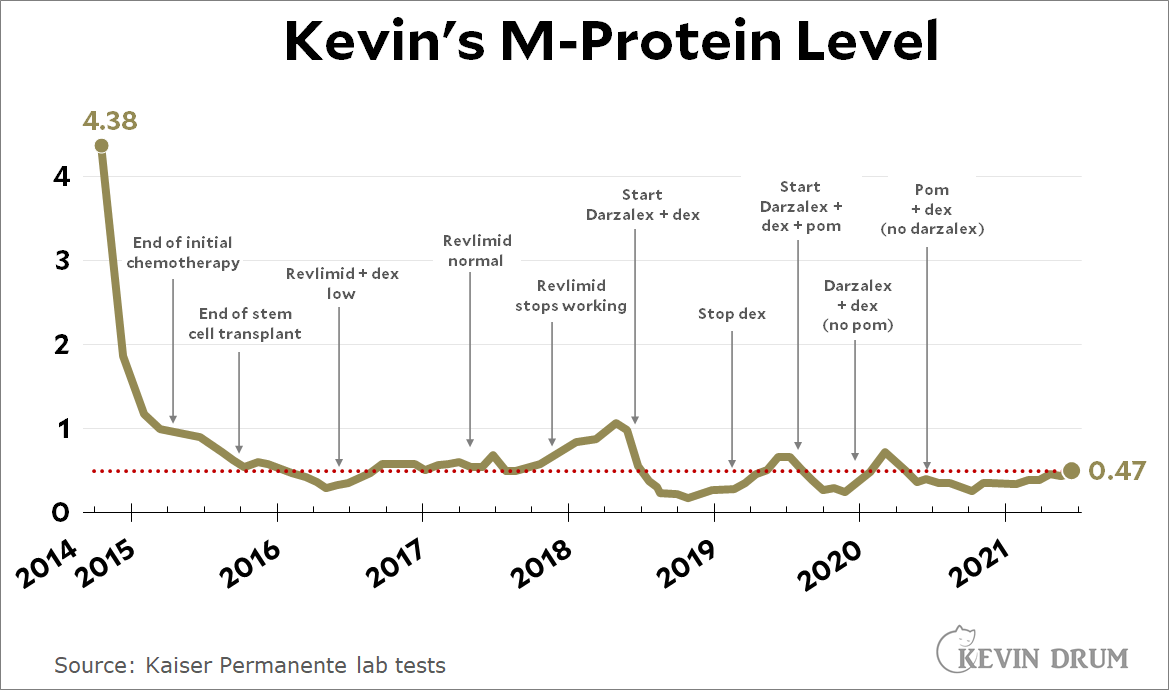
A couple of years ago California passed a law that allowed college athletes to make money from licensing their name, image, or likeness (NIL). At first the NCAA huffed and puffed and threatened that if California went through with this it might ban them from playing football, but no one took that seriously. Nor was it ever plausible that universities in other states would allow California schools such a huge recruiting edge without demanding the same advantage for themselves.

For months the NCAA pretended that it might be able to square this circle somehow, but last week's Supreme Court decision in NCAA v. Alston put paid to that, and today they officially caved in completely:

The NCAA Division I Council — reeling from a Supreme Court ruling last week that further stripped away confidence in the ability of the NCAA rule book to withstand antitrust scrutiny — voted to recommend its board of directors “adopt an interim policy that would suspend amateurism rules related to name, image and likeness,” according to a NCAA statement. The board is scheduled to meet Wednesday and expected to approve this measure.

So that's that. But as much as it seems fair to allow athletes to profit from a system that already profits everyone except them, it's hard to see how big-time college sports (i.e., men's football and basketball) survives this.

The problem is that this is certain to blow up inequality in NCAA sports to unsustainable levels. Take my local powerhouse, USC. They've been planning for this day and are certain to adopt a very athlete-friendly NIL policy. For the top recruits, this can mean hundreds of thousands or even millions of dollars, and football factories like USC can make an easy case that stars on their team will cash in at far higher levels than run-of-the-mill big-conference teams. The biggest programs will have on-campus offices that help athletes find agents and get the best deals. They'll remind recruits that their teams get cherry TV exposure. USC in particular will argue that there's no better place for NIL riches than Los Angeles. By the time this gold rush plays out, there will be maybe a dozen top teams that are so far ahead of everyone else that they're going to have to create a new conference just for them.

Make no mistake: there's not much difference between colleges competing for recruits on NIL revenue and colleges competing on just plain paying their athletes. And once you do that, only the very richest places can survive. Welcome to capitalism.

I don't really know what the answer is to this. I suspect there isn't one. Continuing the strict amateurism policy just wasn't in the cards. Eventually it would fall. But I always figured that once it did, there was no longer any way to keep college teams on even a notional level playing field. If a dozen universities basically run pro programs that are farm teams for the NFL while the rest are essentially relegated to Division II, that's the end of big-time college athletics.

Maybe I'm off base about how this plays out. You never know what kind of weird stuff can turn up. But this is how I see it.

POSTSCRIPT: I've used football throughout as my example, but I suspect much the same would happen to men's basketball. And since those two sports fund everything else, if their revenue dries up then so does every other sport. The dozen or so big schools will be fine, but everyone else will see their athletic budgets crater.

In the New York Times today, Jill Filipovic makes the case that declines in the US birth rate are due to family-unfriendly policy:

Liberals make the (better) case that birth declines are clearly tied to policy, with potential mothers deterred by the lack of affordable child care and the absence of universal health care, adequate paid parental leave and other basic support systems. Couple that with skyrocketing housing prices, high rates of student loan debt and stagnant wages and it’s no surprise that so many women say: “Children? In this economy?”

To judge this, you need to take a look at fertility rates by age. First off, here is teen fertility:

Teen fertility has plummeted strongly and steadily over the past four decades. Since teen fertility has always been viewed as a problem, this should be seen as a policy win even if we don't know for sure what policies caused it. Easier access to contraceptives may have played a role, but the evidence suggests it was at most a small role.

For many years, fertility at higher ages made up for the decline in teen births, but that changed a few years ago:

Until 2007, the fertility of women in their 20s (thin gray lines) remained roughly stable and the fertility of women in their 30s went up. But then things changed: 20-something fertility began a sharp downturn while 30-something fertility flattened out.

It's difficult to make a case that policy changed suddenly around 2007. It also doesn't fit the experience of Europe, where fertility in most countries declined steadily during the exact period (1970-2010) that family-friendly policies became commonplace.

The most obvious explanation for this is one that Filipovic also alludes to: the economy. Fertility peaked in 2007 and began to drop in 2008, the first year of the Great Recession. Its effect appears to have been permanent, and it's been strongest on the youngest women. Since 2007, fertility rates look like this:

  • -63% for teens
  • -40% for ages 20-24
  • -24% for ages 25-29
  • -6% for ages 30-34
  • +9% for ages 35-39

One way or another, the fertility bust in the US seems to have been triggered by the Great Recession, which traumatized young women just entering the workforce far more than it did older women who had been through previous recessions and were entrenched in their jobs enough to be less affected by it. Policy may have something to offer here, but a solid, growing economy seems more likely to turn things around.

Via David Leonhardt at the New York Times, here's the rate of new COVID-19 cases by county:

We could be crushing COVID-19 completely. We have the technology. The main thing stopping us is vaccine skepticism, primarily among conservatives, which conservative politicians and conservative media refuse to do anything about. The contempt they're showing for their own constituents is almost beyond belief.

Over at Vox there's a piece today headlined "Why does it cost so much to build things in America?" It's about the sky-high cost of transportation construction projects in the United States, and it gives me an excuse to post the chart below:

As you can see, New York City truly has sky-high construction costs for transit projects. But the rest of the country is fairly normal. We're higher than some countries and lower than others, probably coming in at a bit over average.

This disparity is so obvious that I think any comparison of transit construction costs should treat the United States as two separate regions: New York City and everyplace else.

As for ordinary highway construction costs, that's more difficult to get a handle on. However, based on several different estimates and studies, it doesn't appear that the US (ex NYC)  has higher costs per kilometer than comparable projects in Europe.

In other words, I suspect that all future versions of this article should be headlined "Why does it cost so much to build things in New York City?"

Expanded unemployment benefits are fully funded through September, but some states have cut them off already in hopes of getting more people back into the workforce. Does this work?

On Sunday, both the Wall Street Journal and the New York Times tried to answer this question. By chance, both of them chose to focus on the state of Missouri. Here's the Journal:

Americans Are Leaving Unemployment Rolls More Quickly in States Cutting Off Benefits

The number of unemployment-benefit recipients is falling at a faster rate in Missouri and 21 other states canceling enhanced and extended payments this month, suggesting that ending the aid could push more people to take jobs.

....Midas Hospitality, a St. Louis-based hotel company with 44 locations around the U.S., started holding job fairs to increase staffing as coronavirus restrictions eased about two months ago....“It’s crazy how quickly” things seem to be ramping up, she said, noting that workers in other states where Midas operates and the federal benefits are still in place appear reluctant to re-enter the workforce.

Spectacular! But here's the Times:

Where Jobless Benefits Were Cut, Jobs Are Still Hard to Fill

By lunchtime, the representatives from the recruiting agency Express Employment Professionals decided to pack up and leave the job fair in the St. Louis suburb of Maryland Heights. Hardly anyone had shown up....Work-force development officials said they had seen virtually no uptick in applicants since the governor’s announcement, which ended a $300 weekly supplement to other benefits. And the online job site Indeed found that in states that have abandoned the federal benefits, clicks on job postings were below the national average.

Both papers used anecdotes and data. And in both papers, the anecdotes matched the data. The Journal says workers are practically fighting over jobs, while the Times says workers are nothing short of disgusted by the crappy jobs on offer.

So which is it? Your guess is as good as mine.

Here’s the officially reported coronavirus death toll through June 26. The raw data from Johns Hopkins is here.

Bob Somerby is discussing Karin Chenoweth's new book, Districts That Succeed, which suggests, among other things, that Chicago has made substantial progress in its schools over the past couple of decades. As usual, that got me curious: has Chicago made a lot of progress? The quickest reference point is their performance on the NAEP test, so let's take a look:

The top chart is for reading at the 8th grade level, and it shows that Chicago performs at about the same level as big cities nationwide. There's nothing especially wrong with that, but it hasn't changed a bit since 2002.

The bottom chart breaks out 8th grade reading scores by race. Hispanic scores have gone up slightly since 2002 and Black scores have made no progress at all. The only change is that Chicago's small cadre of white 8th graders made an 18-point gain between 2011 and 2015 and have mostly maintained it since then.

It's unusual to see such a big gain, roughly equivalent to two grade levels, over the course of only four years. It gets my spidey sense tingling. Nonetheless, even if it's legit it's the only progress Chicago has made. It's been average among big cities for two decades, and neither Hispanic nor Black children, which make up virtually the entire district, have improved more than a tiny bit. If this is success, we sure have lowered the bar lately.

POSTSCRIPT: Everyone has made progress in math over the past couple of decades, and so has Chicago. It has caught up to the big-city average, and all racial groups have improved. However, white students have improved quite a bit more than either Black or Hispanic students.

I generally focus on reading because reading scores are more indicative of success in the real world. I also generally try to focus on 12th graders, but NAEP's TUDA program for large cities doesn't include district level data above 8th grade.