
Here is the average hourly wage for auto workers over the past 30 years:
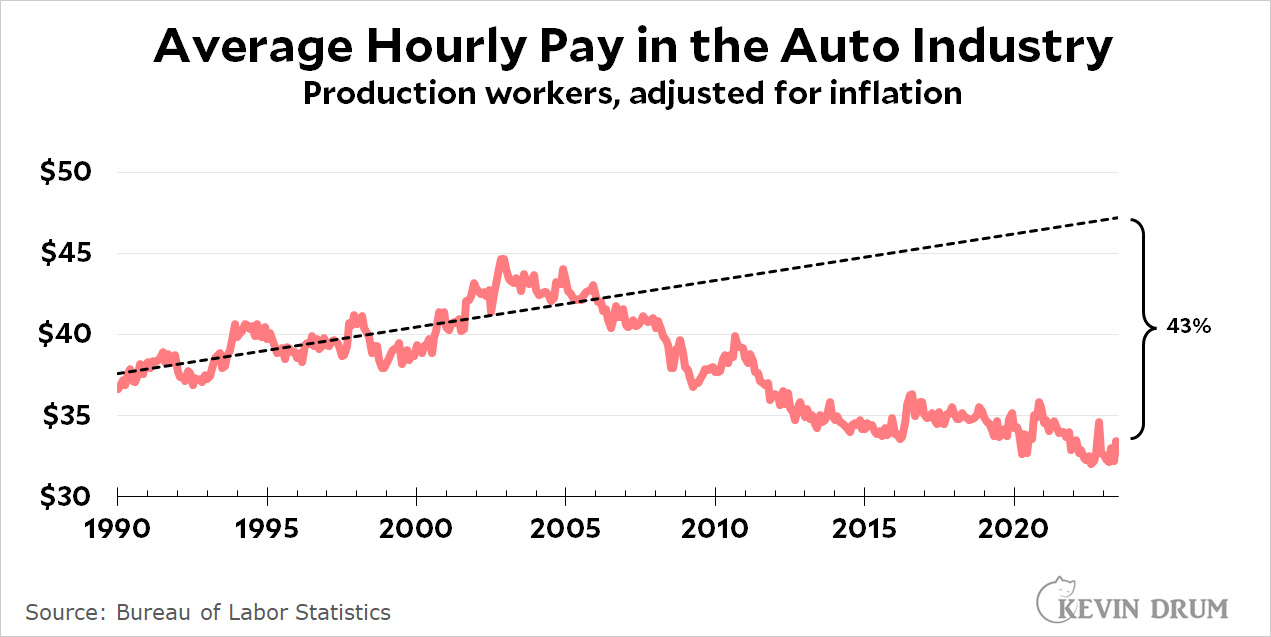 The view of the auto workers is that back when the industry was in trouble they made a lot of concessions on pay to keep the companies in business. Adjusted for inflation, auto workers today make about $12 per hour less than they did in 2005.¹
Now that auto companies are doing well, the unions want them to make concessions on pay that will get workers back on the rising trendline they were on before. This is where the initial demand for a 40% raise over four years came from. That still wouldn't get them back to the old trend, but it would at least get them back to about where they were in 2005.
¹I'm using PCE inflation here instead of CPI because this is a long-term series where it makes a difference. Using CPI, auto workers make $15 per hour less than they did in 2005.
I wonder how much of the wage decline shown here comes not just from union concessions among the Big Three, but the growth of foreign automakers in southern "right-to-work" work states that pay lower wages, as well as Tesla, whose workers make about 20% less than their unionized counterparts elsewhere in the country.
When exactly was that? My initial guess would be 2008-2009 and the Great Recession, but the downturn started circa 2003…
I remember when my K-car was a Mercedes....
Chrysler has been in trouble on and off for many years. The US industry bailed on small cars, then basically cars in general, a while ago. The oil embargoes in the 70's saw the rise of Japanese imports. One of the things that "saved" Chrysler was moving to trucks and making them "manly". And other manufacturers followed---higher profit margins--and benefits (at the time) when calculating CAFE fuel economy if I recall correctly.
The major give backs happened after the 2008 crisis. New employees also started at lower wages and stayed on the low wage track. Retirement went from defined benefit to 401K type--though I'm not sure when that took place.
I'd like to see the salary and benefits for the top management over these years along with "productivity".....
Top management salaries make for great sound bites, but given the usually massive difference in the count of those vs rank and file, you could gut top management pay 90% and it would mean epsilon.
true--but there tends to be an inverse correlation, i.e. higher management salaries for lower line worker salaries. It's definitely not a rising tide lifting all boats.
No one said reverting to the mean was going to leave everyone's hair unmussed...
now do union vs non-union over time.
At some point didn't the UAW and Big 3 agree to a two-track wage scale--higher for the existing employees, lower scale for new hires? I don't remember the time frame, but that would be consistent with your graph, average wages decline as the old employees retire and the new become the majority.
Is the union now hoping to return to a unified wage scale?
Yes, removing the two tracks is one of their demands.
> it would get them back to about where they were in 2005.
That's true as long as there is no inflation over the next 4 years. The UAW initial offer seems low. If I were the Big Three, I'd take this as a sign that the UAW is easily bullied and counter-offer with no pay increase over 10 years.
Can you express/plot as a percentage of company profit? You say “now that the companies are doing well” but it’s tough to judge how much the hourly wage decline does/doesn’t parallel with corporate profits.
Coupla things here. First, as I'm sure everybody knows, it's not just about the wages. Second, and more significant for the long term, the UAW is looking to curtail the tactic of eviscerating it's bargaining power. No more shuttering plabnts and reopening in RTW states, no two-tier benefit system designed to pit the union against itself, etc. In this respect, they are exactly like their striking counterparts, the WGA, the AMPTP, and the SAG-AFTRA. The time has long since passed for the representatives of labor to stop playing defense and go on the offense, or so they reckon, and I can't say that I blame them; if workers hail from the frog family, management has shown again and again and again that they are irredeemably scorpion people ... and don't feel particularly ashamed that they are. That's part of what makes them scorpions.
It's a nice chart but it's not clear why the rise from 1990-2005 as a trend is dispositive, and the decline and flattening since 2005 is the anomaly, industries don't necessarilly move in constant straight lines. What was the trend from 1945-1990? What's overall revenue/profits? This single chart is a lot less useful than Mr. Drum seems to think.