
Here are all the episodes of high inflation that we've had over the past 70 years:
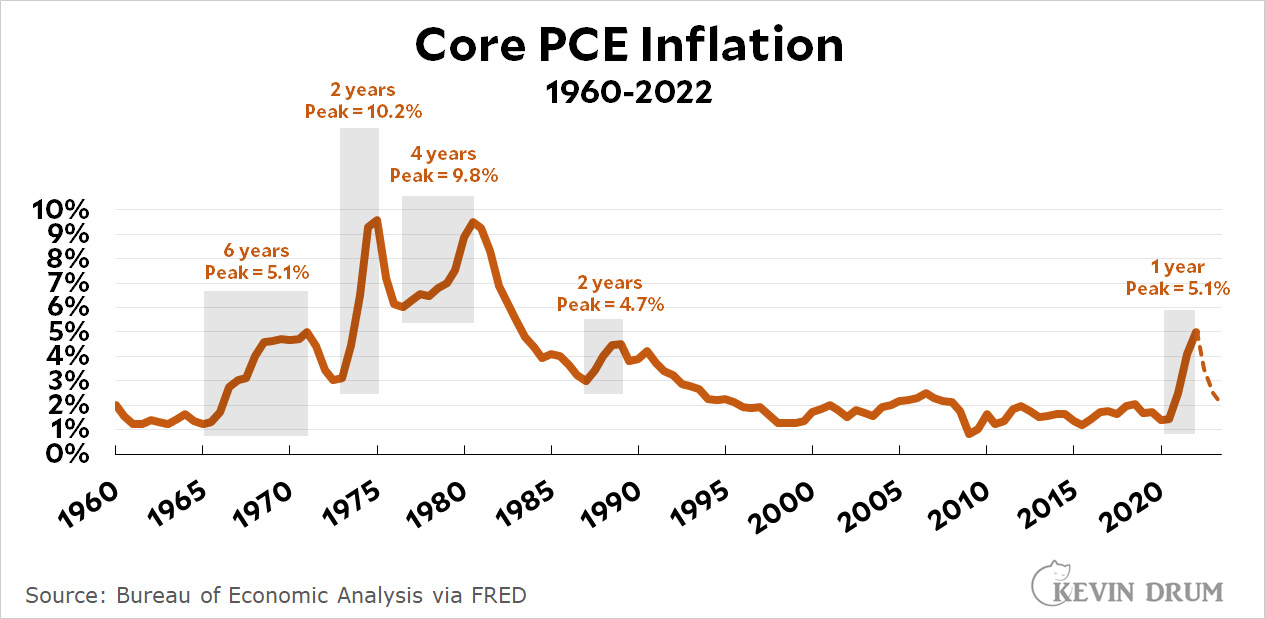 The time frame for each episode is from trough to peak. I used core PCE as the measure of inflation since that's (allegedly) what the Fed uses.
So is our current inflationary episode big or small compared to those in the past? Assuming that it's reached its peak and will now start declining, the answer is probably "small." But it seems pretty big because 30 years of the Great Moderation has gotten us in the habit of thinking about nearly any bout of inflation as catastrophic.
With Yogi Berra ever vigilant, that is something of a large assumption.
70 years? 2022-1960=62 … that seems to be a bit of, well, time inflation…
He claims to show all of the episodes of high inflation over the past 70 years, not to show 70 years of data. Core CPI only goes back 62 years, but if you look at the standard CPI series, it appears that there was an inflationary episode that ended in early 1952, so just a bit outside of the 70 year window, and the following episode didn't start until 1965.
COVID deaths seem pretty big because a century of antibiotics has gotten us in the habit of thinking nearly any outbreak of disease is catastrophic.
Antibiotics have pretty much fuck all to do with the management of viral diseases of which Covid19 is a sub-example, otherwise the flu, etc.
You missed his point, which was not pharmacological, but had to do with mass perception.
Assuming we've reached the peak, that's correct.
But one unnerving factor is the speed. Previous episodes took longer, at least 2 years vs 1, to reach the level/the top we've achieved in 2022.
That's certainly panic-inducing if you're a technocrat in charge of controlling inflation...
Not panic inducing but certainly concern inducing. Particularly if you have the historic econometric data of the 1970s and have an awareness of those economic policy errors of the 1968-1978 period. That period seen in the charts there contains a lesson of how heavy motivated reasoning jumping to conclusion "inflation is over" embeds significant risk.
The inflation risk denialist Left is virtually rerunning the same kind of errors of the 1970s - all in a misframed reaction to the Right (which yes did spend three plus decades in crying wolf about inflation, but rather than reacting with denialism, the Democrats should react proactively to build a management credibility).
The peculiar and disappointing ongoing inflation denialism from Drum - motivated as far as one can tell by strongly "motivated reasoning" from political reaction predicated on the unstated idea that the inflation bout discredits preferred policies (that is the government stimulus). What is more discrediting is the post-facto denialism than an actual burst of inflation.
The graph's illustration (similar are seen in other country contexts) 1970-1980 segment rather illustrate the risk of denialism, also a feature of the period, and the risk for the Left in committing the same or essentially identical policy errors for similar reasons. That is peak, in early 70s, decline, pivot from inflation fighitng too early, re-acceleration. In terms of magnitude from the base trend (that is a higher baseline of inflation for that period), the peaks and swings are quite similar.
While Drum is pissing on the Fed (in an uneducated fashion based on half-understanding) inflation fighting they are in fact helping the Democrats in the medium term (if they continue) from repeating the 1970s errors and ending up like in the 1970s with a trashed reputation.
There is nothing to deny. Do you understand how these things occur??? It's panicking vendors. It's a long winded downturn in auto production(which hopefully is over). It's a bad year for animal commodities.....which likely won't happen again and yry oil prices look disinflation by next year.. These are baskets which bean counters use to create "inflation" .
Your as bad as Drum Loud. Your trying to tell a story rather than looking at reality.
Amusing, your word salad habits.
To buy the transitory concept one must believe one or all of the following:
1) Believe that normalization of supply chains is the primary solution to inflation. However, how are supply chains causing rapid rent growth or large increases in domestically produced products such as eggs?
2) Inflation was not caused, in part, because of the aggregate stimulus payments. The challenge to this point is several OECD countries, South Korea, Japan, Australia etc are subject to global supply chains and don't have high inflation.
3) Or that inflation at a stable 2% is an inappropriate goal.
2) is just wrong. Stimulus payments have ended, so inflation caused by them must end once the (presumed) excess spending ends - it must be transitory. Note that economic stimulus need not be inflationary; it only leads to excess demand to the extent that it exceeds the income losses due to the pandemic. I haven’t seen any comparisons of the total stimulus compared to the total losses of business and individual income, can you point me to any?
Conversely, to support an argument that inflation is not transitory (permanent?), one needs to show that a mechanism is operating that will continually force price increases. The usual suspects are the wage-price spiral and the expectations-purchase advances positive-feedback loops. Some of us don’t see either of those actually operating.
Looks like a micro inflation, not macro which the 70's were. 00's had micro inflation as well.
If I recall correctly the first was Keynesian-triggered, the second came from decoupling gold, the third was the embargo, and the fourth was the rebound from the end of Volker's war.
and the 30 year lull in inflation was due to outsourcing production to low wage countries....
Yeah, they way I learned it inflation really shot up from OPEC’s embargo against the countries that supported Israel in the 1973 war, and oil went from $3/barrel to $12/barrel that year. Then in 1979 worries about the Iranian revolution doubled a barrel of oil globally from $20 to $40/gallon.
Others emphasize LBJ’s Great Society spending, Vietnam war spending, with declining tax revenues, pushing Nixon to finally break the dollar/gold peg in 1971. Fuzzy on the details, but the peg was not reflecting the US dollar had lost value (from inflation) - the peg kept it artificially strong against gold. So everybody takes their USD and keeps converting it to gold at the pegged exchange rate. A run on gold; dumping dollars on the market, (USD value wants to go down) snatching up gold with a dwindling supply (AU value wants to go up) exacerbating the imbalance of the peg, until it has to break.
I think that’s how “fiat currency!!@“ people see it.
Then Volker in early 80’s did his thing.
The first episode in Kevin’s chart is attributed to LBJ’s ‘guns and butter’ policy, of expanding domestic spending while waging the Vietnam War. It was not Keynesian.
Apropos of nothing, regular gasoline is now down to $3.19.9 along my morning route.
or apropos of everything...
Q22022 CPI - Q42019 = Δ headline inflation percentage points
NL = 7.4
US = 6.6
CA = 5.4
NZ = 5.4
SK = 5.1
MX = 4.9
AU = 4.3
Interesting that those Boomers born in 1955 entered the workforce in droves in 1975 at the age of 20 - keep in mind the majority of kids were NOT going to college then !!!
This is why I'm always harping on the job creation of Reagan, Clinton, Carter and Obama as being stunning. They absorbed the baby boom age group into the work force
But get this. the birth rate in the 1800s was roughly 48.3 births per thousand people. It dropped steadily until the. This si the crude baby boom after WWII rising back up to 24.1 and is expected to drop to 12.1 per thousand in 2020.. This is the crude birth rate. Just over 1% of our population will be newborns right now. By 2050 80% of our population will be over 65.
Labor shortages will be wide spread.
Unless we find a way to legally kill us old timers off
dropped steadily until WWII..........and the subsequent baby boom
High inflation tends to co-incide with high employment figures rather nicely.
Some people like Jimmy Carter and Saint Ronnie did it be increasing government debt - Carter alone increased the national debt by 48%.
But both of them saw a huge influx in the number of people participating in the work force as the boomers came of working age. Any down turns since then would have affected many more people so Clinton doubled down on job creation efforts.
The work force we have right now is a result of 50 years of economic stimulation and that work force is leaving !!!!
I sure hope the feds can soft land this thing - BUT - one thing is vastly different than previous situations. There are far more consumers of goods and services than there will be providers of goods and services. This is far different that the 'almost at equilibrium in the work force' situations of the past. We have far more consumers than producers and even technological and efficiency improvements are not keeping pace with the demand for those goods and services.
As I noted in another thread, a market isn’t just people, it’s people with money to spend. Production and consumption can’t get too far out of line; one person’s spending is another person’s income. If we in the OECD countries do experience growing labor shortages, it will be resolved through a combination of increasing the pace of automation, increased offshoring, increased immigration, and (no doubt as the last resort by employers) higher wages to attract more people into the workforce.