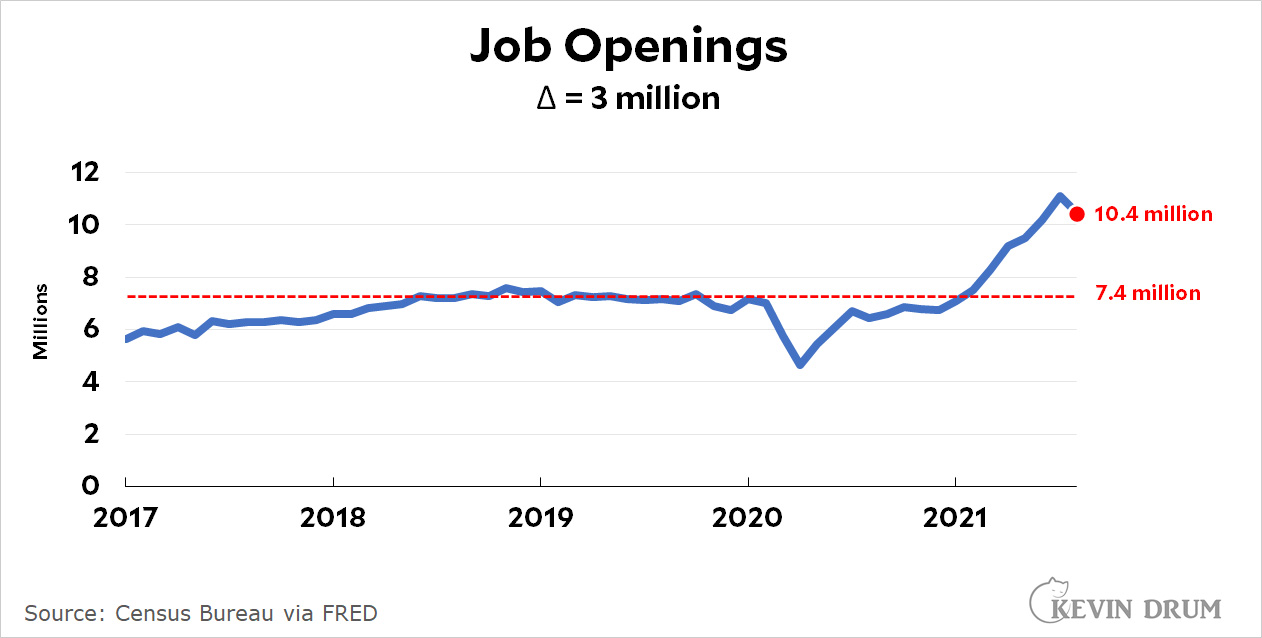
An op-ed in today's LA Times got me thinking. When we talk about employment and job openings, we shouldn't be comparing raw numbers. We should be comparing our current situation to the situation just before the pandemic. That, after all, was a very strong economy and represents about the best we can hope for. With that in mind, here are three charts. First, job openings. The dashed line represents the 2019 baseline.
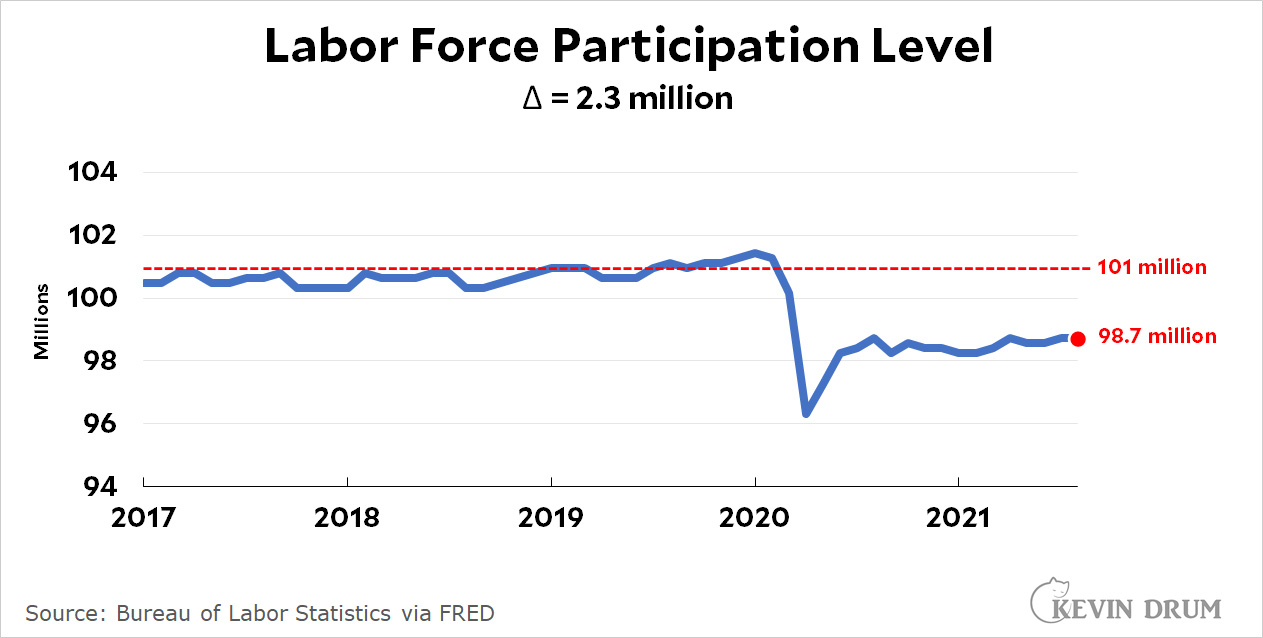
 Next, the labor force participation level:
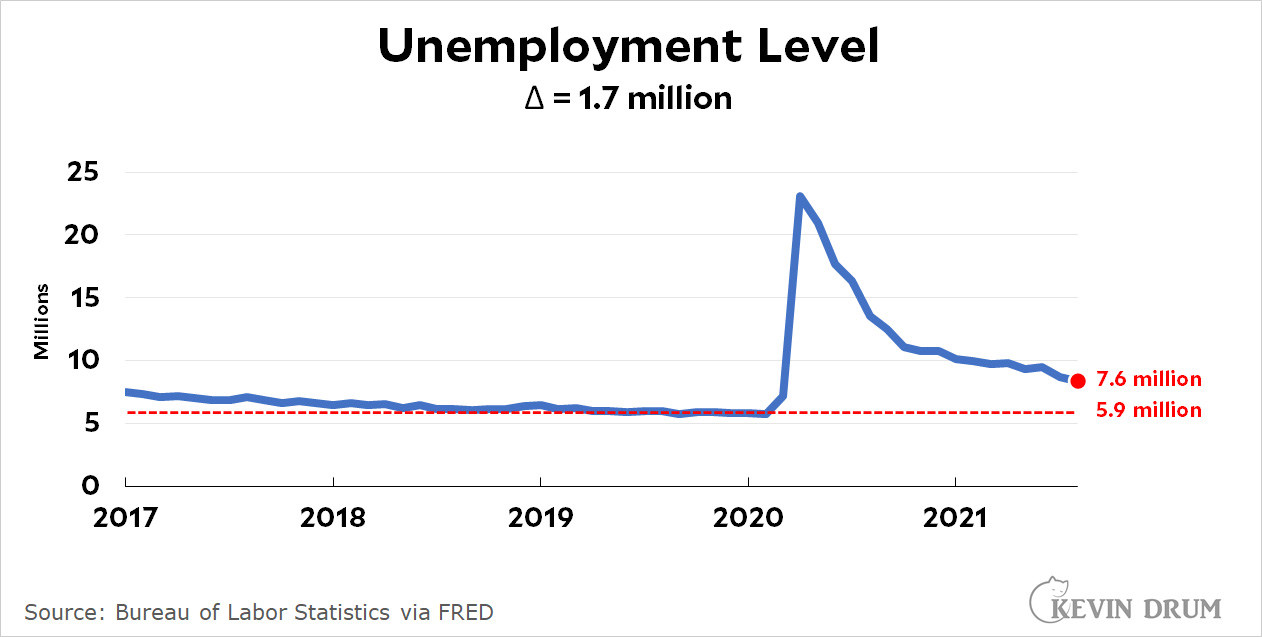
 Finally, the unemployment level:
 On the employer side, compared to 2019, there are about 3 million more job openings than usual.
On the employee side, it would take about 2.3 million workers to get to the 2019 labor force participation level. Likewise, the unemployment rate tells that there are currently about 1.7 million more workers looking for jobs than in 2019.
This . . . suddenly doesn't look like such a crisis. Give or take a bit, you can conclude that there are 3 million more job openings than usual and about 2 million more workers looking for jobs than usual. That amounts to a worker shortage of about 1 million people.
So, yes, there's a worker shortage, and it's going to take higher wages to lure those workers back into the workforce. But in real life, the worker shortage isn't nearly as big as everyone is making it out to be.
Pingback: Here’s your worker shortage in one chart – Kevin Drum
Does the qualifications of the unemployed match the skills/education needed for the vacant jobs?
A question from your Swedish friend
Does they?!
Some of us do not claim any supercilious friends.
Why would the qualifications change from before the pandemic? Most of the jobs lost were low level, in the industries shut down such as restaurants and entertainment. This is why average wages suddenly jumped up in 2020, not because of any actual wage increase (though there were some bonuses). Higher level people tended to be able to work from home and were less likely to be let go, as being harder to replace.
In eyeballing the chart, it looks as if it would take 2.8 million workers to reach the peak of 2019, I see you went with average, and that may fine, but one should be specific as to the number. The one chart you don’t provide and I would like to see is total workforce actually working. I think the deficit there is 5 million in absolute numbers. I think the participation number is different in that that is based as a percentage that shifts. If I’m mistaken I would certainly welcome a correction.
"When we talk about employment and job openings, we shouldn't be comparing raw numbers. We should be comparing our current situation to the situation just before the pandemic.'
Wrong assumption
Pre pandemic people who wanted to work continued to work right up to the pandemic even though they were retirement age. They were considered part of the workforce at that time
They may have retired Kevin. So you are basing your numbers on a soft assumption that the same people that were working pre pandemic want to work post pandemic.
they may not............
To refer again to the BLS employment numbers, which are about the rawest kind of data:
https://fred.stlouisfed.org/graph/?g=HCqc
There were 152.5 million people working before the pandemic in 2020, whereas now now there are only 147.5 million. Now some have died or been incapacitated by covid (although others have come to working age), but this still shows rather unequivocally that about 5 million potential workers are still out. This does not mean that the economy is operating at a level that requires those 5 million *now* - it would presumably require them if it were operating at the early 2020 level. So how many workers employers want now is presumably a smaller number, but not one which can be easily pinned down.
The "labor force participation level" which Kevin shows is not people employed, it is both employed and people actively seeking work. As a fraction of the prime-age population it was distinctly higher at the peak around 2000, indicating that there may be even more people who would go to work under the right conditions.
But as for what is necessary to get people to go back to work, as I said in a comment to the last post, workers may come back when they run out of stimulus money, and/or when covid danger has decreased. The smaller the job gap, the less likely it is that major wage increases will have to come into play.
The great majority of covid deaths have been of people over 65, so the fraction of people of working age in the population may have increased.
All true skept
But in our world of do more with less, just-in-time and lean Six Sigma any ripple was going to cause this exact same scenario.
The difference is that now that they have opened their doors to their work forces again there's not a crowd rushing in for various reasons.
One of which is fear of covid. I'm of the belief that even though we have more money than ever people were still living paycheck to paycheck and they have used their stimulus already.
I do believe we will even out, but it will take another year possibly two.
While employers who are seeking to make "goods" are raising wages to attract more workers BECAUSE they have JIT, or LSS
Just to review the employment numbers again, since this can be confusing, there are about 5 million fewer people working now than in early 2020. This number is unequival in indicating the minimum pool of workers who might be persuaded to come back at the wage levels of early 2020 - they were doing it then, why not now? Has there been a universal and permanent change in the attitude or collective power of workers, or is it a matter of stimulus money and covid fear? If the former, then maybe there will be more wage increases, but if not then things will probably revert to the early 2020 situation and workers will have to go back to their old lousy jobs.
skept-
Keep in mind that Social Security operates on the federal fiscal year schedule which runs Oct 1 through Sept 30. Actual numbers of retirees will probably not be released until 2Q FY. That means we will find out Jan/Feb of 22
We can guess and I do agree with your (BLS) numbers.
But when you ask:
"This number is unequival in indicating the minimum pool of workers who might be persuaded to come back at the wage levels of early 2020 - they were doing it then, why not now?00"
We may not know that answer until Jan Feb
Is it possible that 5 million retired? Yup. The number indicate older workers LOVE to work for whatever reason. Some estimate put the number of workers between the ages of 65 and 71 at about 13 million pre-pandemic.
They could have easily said "Now's the time"...................
This would also explain (partially) the demand for service industry workers. Just as we re-open and 5 million extra folks are now looking for ways to get waited on...................
Skept-
We are approaching workforce participation levels not seen since the 70s
But its about to get much worse:
https://www.bls.gov/news.release/ecopro.nr0.htm
{snip}
Total employment is projected to grow from 153.5 million to 165.4 million over the
2020–30 decade, an increase of 11.9 million jobs, the U.S. Bureau of Labor Statistics
reported today. This increase reflects an annual growth rate of 0.7 percent, which is higher than recent projections cycles and accounts for recovery from low base-year employment for 2020 due to the COVID-19 pandemic and its associated recession.
Employment in the leisure and hospitality sector is projected to increase the fastest, largely driven by recovery growth, while the healthcare and social assistance sector is projected to add the most new jobs. Among occupational groups, healthcare support occupations are projected for the fastest job growth.
Real Gross Domestic Product (GDP) is projected to grow 2.3 percent annually from 2020 to 2030, relatively quickly compared to the prior two decades, when GDP grew 1.7 percent annually. Meanwhile, labor
productivity also is projected to increase, from 1.1 percent annually over the 2010–20 decade to 1.7 percent annually from 2020 to 2030.
{snip}
So, workers retiring in droves with lower population growth since 66 and increases in jobs.
This is a recipe for disaster.
Something to remember when we're looking at numbers of this size: we just lost almost a million people to Covid, death and long Covid disability. Yes, many were older, but most of the younger ones were disproportionately from the front-line industries that no one talks about. Slaughterhouses. Line cooks. Store cashiers. All much higher rates than first responders who get all the attention. A non-trivial part of the drop in workforce is terminal.
And I saw a report the other day from an industry organization that collects exit interview data (so, mostly large companies). Fully two thirds of the workers quitting cited customer abuse as the main reason. Retail & service workers are always underpaid, generally poorly managed, and usually disrespected - but they carry almost all of the burden of actually having to enforce society's basic thresholds of public sanitation, which the mask issue is.
So if some workers are feeling like their bosses don't care and aren't paying risk-my-life wages but are risking their lives anyway, they aren't working. And that makes sense to every actual capitalist. The only people who can't accept that are the dictator wannabes, who think that owning the company means that they own the workers.
Well, you've also got to realize that back in the "strong economy" of 2019, many people had to hold two or more of those jobs just to get by. That drove down the "job vacancy" figure significantly.
*******************COVID NEWS****************
My poor home state of RI. Good grief what is going on there?
https://www.golocalprov.com/news/42-of-COVID-Infections-in-RI-Are-in-the-Vaccinated-Ten-Deaths-Reported-i
{snip}
It’s a tremendous relief that total COVID infections in the country over the past few weeks are declining, including a small decrease in Rhode Island. However, the pandemic is far from over. Every state is still at a High, Very High, or Extreme Risk of infection. More than 1,500 people are dying every day from COVID - the equivalent of 15 fully loaded airliners crashing daily. Every day more than 75,000 new infections are reported (with the actual number certainly much higher) – the equivalent of everyone in Rhode Island becoming infected every two weeks. Rhode Island is reporting 247 new cases a day – 10 people every hour – with the actual numbers again likely much higher. New hospital admissions for COVID are up to 97 this week from 78 last week.
Vaccination alone is not a magic shield.*********Last week 42% of COVID infections in Rhode Island were in vaccinated individuals, up from 39% the prior week.*************
Even more concerning may be COVID deaths. ************Two weeks ago 50% of COVID deaths in Rhode Island (5/10) were in vaccinated individuals. Last week all 5/5 COVID deaths in the state were in the vaccinated. *************
In the past three days, Rhode Island has suffered 10 deaths, according to the RI Department of Health. It is unknown if any of those individuals who died were vaccinated.
{snip}
The numbers by themselves are small. It's the percentages that are bothersome.
Yes, as some have pointed out the first to get vaccinated were those at risk. Those with immuno compromised diseases like Colin Powell who had multiple myeloma.
But at 50% death from breakthroughs? I can buy some of that argument but the numbers are too high for that. Besides the Israeli study that first indicated the rate at which vaccines are wearing off was done on their health care workers who were NOT compromised, at all. These would be considered "healthy" people.
We NEED to get booster shots to everyone and soon.
"When we talk about employment and job openings, we shouldn't be comparing raw numbers."
IANAE, but I rather think that we should be looking at most of these numbers in terms of marginal change, rather than "raw numbers." A substantial number of job openings and of unemployed workers are fairly stable products of routine churn, as evidenced by the very stable pre-COVID numbers of opening and unemployed. What happened during and now after the impact of the pandemic is quite eye-popping if read as marginal change, which I think is what most economists are doing when they express alarm or wonder at these numbers. But economists are notoriously bad at explaining things, and many people don't think too hard about the difference between total and marginal changes.
But for an employer looking for new employees, the large marginal change is what she's facing, making it much harder to find new employees without substantial wage increases (which are, on the whole, long overdue and likely to be stimulative anyway).