
Here is 60 Minutes on housing:
Nicely done @FairweatherPhD. Time to build! https://t.co/qw5zaNxdVK
— Adam Ozimek (@ModeledBehavior) March 21, 2022
I don't get it. People keep saying stuff like this, but:
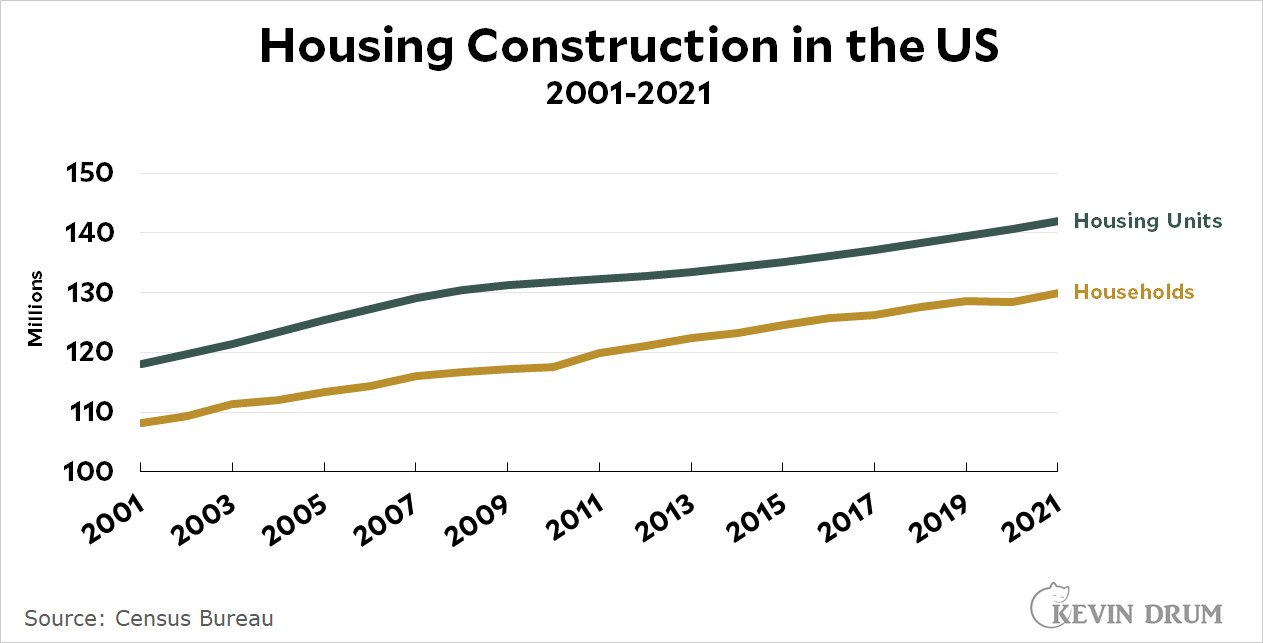 There are housing shortages in California and in specific cities that are hot destinations right now, but overall the US has been building houses at close to the same rate as always. Since 2001, when this data series starts, we've built 24 million housing units for 22 million new households.
Because people only live in New York and Los Angeles, and Washington, D.C., and sometimes San Francisco.
Those are the only places.
Even in small cities of over 100k the housing prices are fucked.
All it takes is a look at various regions, particularly metro areas starting at about the 250-500k population size, to see that households in those areas have greatly outpaced housing construction in the same areas. Unfortunately, the data on the number of housing units in 2010 and 2019 isn't super easy to find. Not all metro areas or states show population growth outpacing housing unit growth by large margins, and I'm sure there are some cases where housing units have kept up with or outpaced population growth, but those are exceptions.
Here are the fastest-growing MSAs by population and with at least 250K residents, from Census data, with nearest "round number" population in 2019 listed and percent change since 2010:
1. Myrtle Beach (500K, 32%)
2. Austin (2.25M, 30%)
3. Greeley, CO (325K, 28%)
4. Fort Myers, FL (775K, 25%)
5. Provo (650K, 23%)
6. Raleigh (1.4M, 23%)
7. Orlando (2.6M, 22%)
8. Boise (750K, 22%)
9. Fayetteville, AR (540K, 22%)
10. Charleston, SC (800K, 21%)
11. Crestview, FL (285K, 21%)
12. Lakeland, FL (725K, 21%)
Not exactly your NYCs, LAs, SFs, and DCs of the country. Austin and Orlando are the only ones that even come close, and I added the bottom 2 because if we want to have an anti-huge-city bias here (because for some reason we want to exclude areas where just tons of people live, because that makes sense? lolol it doesn't)... Source here: https://www.census.gov/data/tables/time-series/demo/popest/2010s-total-metro-and-micro-statistical-areas.html, cumulative tables sorted by percent change.
Census data on housing units is currently only published by state (https://www.census.gov/data/tables/time-series/demo/popest/2010s-total-housing-units.html), but here's the percent change in total housing units for the states that have MSAs listed above:
Arkansas: +5.5%
South Carolina: +10%
Colorado: +11.4%
Utah: +15.7%
North Carolina: +9.7%
Florida: +7.6%
Idaho: +12.5%
Texas: +13.1%
Population change of those states, 2010 to 2019:
Arkansas: +3.5%
South Carolina: +11.3%
Colorado: +14.5%
Utah: +16%
North Carolina: +10%
Florida: +14.2%
Idaho: +14%
Texas: +15.3%
We all know that housing markets are regional, not national. Combine the urbanization of the population with the fact that population is growing faster than housing units in the places where population is growing the most...
The problem is that housing units are not where the population is, and it's happening across the entire country - not just in the biggest metro areas. It's why these repeated charts by Kevin that just show national population (or national household counts) and national housing unit numbers are completely misleading. People (and therefore housing demand) moves faster than housing units can be built.
Housing markets are really by neighborhood. At the very least conversations about housing demand/supply need to be at the city level but even that is deceptive because, for example, the exact same house in a NW neighborhood of Chicago will cost between 4 and 10 times what it would cost in a neighborhood on the SW side.
Getting data on housing units within a specific market is cumbersome but possible. Census data aggregated by services such as Spotlight (formerly Nielson Claritas), which is frequently used by planning agencies, lenders etc, provides housing data at tract level. Metropolitan planning agencies often collect and publish it on a city level within their region. Building permit data is available in many cities.
Right, by city works because at least within cities there can be movement between areas with high demand and low demand.
Building permits isn't really a count of total housing units - it doesn't count housing units lost to demolition or consolidation, for example.
I was able to find some metro-level planning documents about housing units, but it wasn't a 1:1 with the Census data.
thank you for these thoughtful responses.
i normally like contrarian kevin but this is not smart
The focus does seem to be in hot areas where first time home buyers are competing with corporations--where decent homes with nice yards run $300K. Compare that to where I grew up, decent homes run ca. $120K.
Looking at median home prices vs median income:
https://www.cnbc.com/2021/11/10/home-prices-are-now-rising-much-faster-than-incomes-studies-show.html
That's the problem.
should note:
1. Interest rates also affect payment schedules and affordability
2. Rise of two income households over this time frame, late 60's till 2020ish
The root of it is there is only so much “there” where everyone thinks they want to be but plenty of everyones…
The rate of house building was severely depressed after the puncture of the housing bubble in 2006-9:
https://fred.stlouisfed.org/graph/?g=NdQX
This is despite record low mortgage rates. Although the rate has been steadily climbing, it is only now getting up to some previous post-WWII lows. Why this should suddenly result in explosion of prices is another question.
Yep. All it takes is a basic knowledge of "area under the curve" to see that the total underbuild during the 2010s bust is far higher than the total overbuild during the 2000s bubble.
"For millennials", Keven. Kinda like how the Second Amendment has this stuff about "militias". For example, uptown Manhattan condo going for a cool 3 million is not a starter home for a millennial but a tax write-off for a Russian money-laundering operation, a R&R spot for a billionaire in town once a quarter, or a Chinese princeling to use as a "residency" for college mailers.
A trailer park with 20 slots that's 200 miles away from a major metro center is the same way.
Trailer parks have seen huge increases in fees as they are taken over by investment firms.
In my neck of northern California - Sacramento area - new home construction is going full blast*. I guess if you only venture out into areas where there's no new home construction, you can more easily make silly claims like "we need to start building new homes!"
* - Yes, this is anecdotal evidence. But I defer to Kevin's chart, which is fact based.
Sorry, what's a household?
Is it possible that 10 years ago a household was 2 recent college grads deciding to live together, but now it's 5 recent college grads deciding to live together because that's the only way they can afford rent?
This is also an issue - household formation is at an all-time low. https://www.pewresearch.org/fact-tank/2021/10/12/u-s-household-growth-over-last-decade-was-the-lowest-ever-recorded/
Overall, the household formation rate declined slightly from 51.5 households per 100 adults in 2010 to 50.9 households per 100 adults in 2020.
I don't know what the details of your dataset are, but perhaps one issue is how households are defined. If millenials and gen z are living with their parents or in group rental housing or whatever, the technical number of "households" could be artificially skewed downward by the unaffordability and availability of housing.
Not artificially, it is in truth: https://www.pewresearch.org/fact-tank/2021/10/12/u-s-household-growth-over-last-decade-was-the-lowest-ever-recorded/
"Overall, the household formation rate declined slightly from 51.5 households per 100 adults in 2010 to 50.9 households per 100 adults in 2020."
In your example of people living as roommates or whatever in shared housing, it depends on how they're counted. Obviously on their taxes they're individual households, but for this data I don't know.
Yeah, "artificially" was poor word choice. What I meant was skewed down in a way that made comparing household growth with housing unit growth could provide a misleading impression. What does population growth vs housing unit growth look like?
We may have 24M more housing units now while only adding 22M households, but more than 2M households moved from rural to urban counties between 2001 and 2021 per the 2 Pew sources below:
https://www.pewresearch.org/social-trends/2018/05/22/demographic-and-economic-trends-in-urban-suburban-and-rural-communities/
https://www.pewresearch.org/fact-tank/2021/10/12/u-s-household-growth-over-last-decade-was-the-lowest-ever-recorded/
The US has more than 120M households.
But going beyond all of that:
Housing markets are regional, NOT national. How many of those total housing units are vacant units in depopulating areas?
According to this chart: https://fred.stlouisfed.org/series/HOUST
According to this chart: https://fred.stlouisfed.org/series/HOUST
...the number of housing starts was about average in 2007 and stayed below average--in some years WELL below average--until recently.
It's also obvious to me that for most of U.S. history it was pretty easy to build as many units as you wanted wherever you wanted--if you owned land close to jobs you could build apartments on it. That stopped being legal in most cities in the country in the '50s and '60s. We also made it a legal requirement that most people needed to pay for a parking spot or *spots* even if they didn't need one.
We may not have seen the downside of these policies for a few decades because most cities were falling from their peak populations and it was easy to build homes in farm land out by the new highway. Now that most of the easy to develop hinterland is full and people are interested in living closer jobs in cities again, it isn't legal almost anywhere to build a 12 story building full of one-bedroom apartments and no parking almost.
+1
Well we can all blame our favorite piece of planning requirements. You don't like parking spaces, she thinks the seismic rules don't meet cost-benefit analysis, I don't like the requirements for so much garden square footage per house square footage.
I'm not sure where that, as unprincipled complaining, gets us.
Every person has much that they like in zoning regulations, and a few things they hate. Until we agree on meta-issues, like what we're actually trying to achieve through these regulations, all we have is a list of who's complaining about what...
Doesn't number of dwelling units constrain number of households. You can't say the titanic has sufficient lifeboats because they're being deployed at the same rate as they're being used.
I think looking at housing starts vs population (or more ideally pop growth) is more illuminating, but you also have to control for dwelling types as there's a lot more small condos now encouraged by zoning vs SFH, though the houses that do get built are bigger.
https://www.whitehouse.gov/cea/written-materials/2021/09/01/alleviating-supply-constraints-in-the-housing-market/
in addition to comments above about regional vs. national, the quote says that not enough housing was built for millenials, not the population in general. There are not enough smaller, "starter" homes being built.
> There are housing shortages in California
Water shortages too.
This chart assumes that housing construction was sufficient to meet demand. It never was. The cumulative shortage is catching up to us.