On Wednesday I wrote a post saying we didn't have a housing shortage. I got a lot of pushback on that, so I figured I'd take a deeper look.
The result is a big pile of charts. Basically, it's everything I could think of related to housing with no cherry picking and no game playing. I just picked out everything I could think of that's an indicator of housing supply. Many of the data series go back only to to the year 2000, so I started them all off at 2000 to make sure of comparing the same time period for everything.
Some of you will undoubtedly have some issues with all this, but wait until the end before you go ballistic. After the charts are done I'll have a bit of discussion. Then you can go ballistic, OK?
First up is growth of housing units vs. growth of adult population:
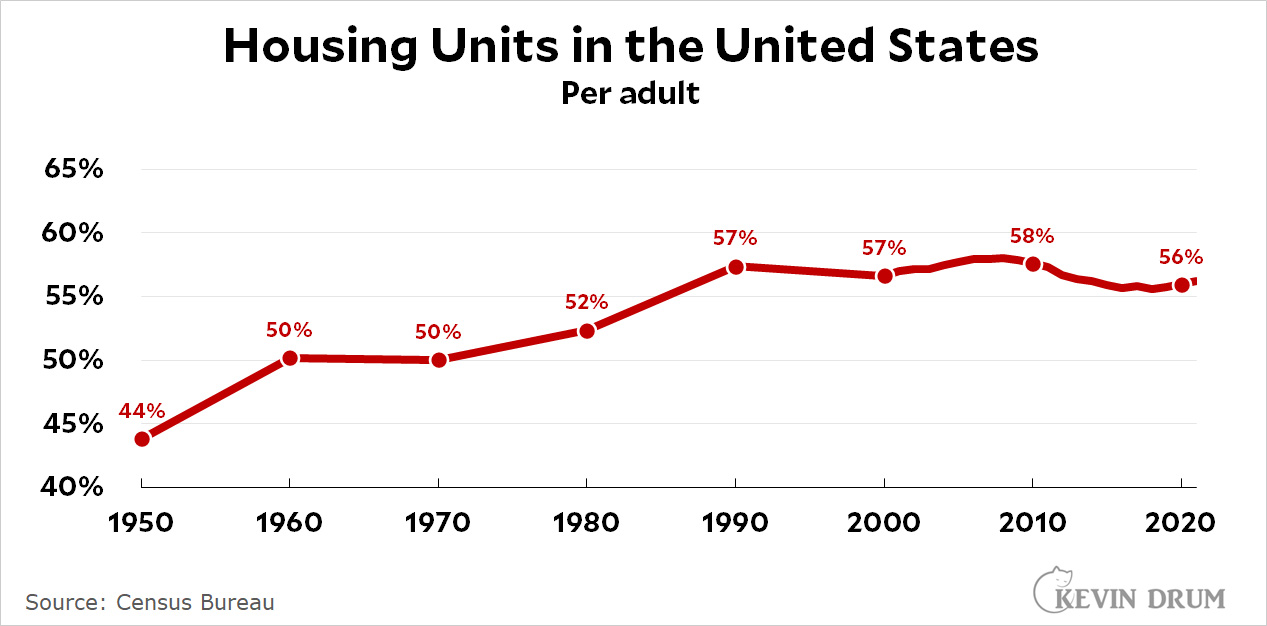 "Housing units" mostly includes single apartments and single-family homes, but it also includes everything else people live in: mobile homes, houseboats, or any single room intended for occupancy as separate living quarters.
I charted this over a long period in order to provide some context. After World War II there was a huge shortage of housing as soldiers returned home and got married. It was a major political issue that produced housing developments like Levittown; the growth of suburbs and interstate highways; and a huge increase in housing projects for low-income families.
The result was strong growth in housing units, followed by another strong growth in the '70s and '80s as the baby boomer generation grew up and moved out. More recently, growth slowed down: In 2021 the number of adults barely budged, ending at 252.6 million. The number of housing units ended up at 142 million, for a ratio of 56.2% (compared to 56.6% in 2000).
You can draw your own conclusions from this. On the one hand, housing growth has slowed down considerably. On the other hand, this was largely because population growth also slowed down considerably. On a countrywide basis, we have the same number of housing units available per adult as we did 20 years ago.
The next chart shows housing vacancies:
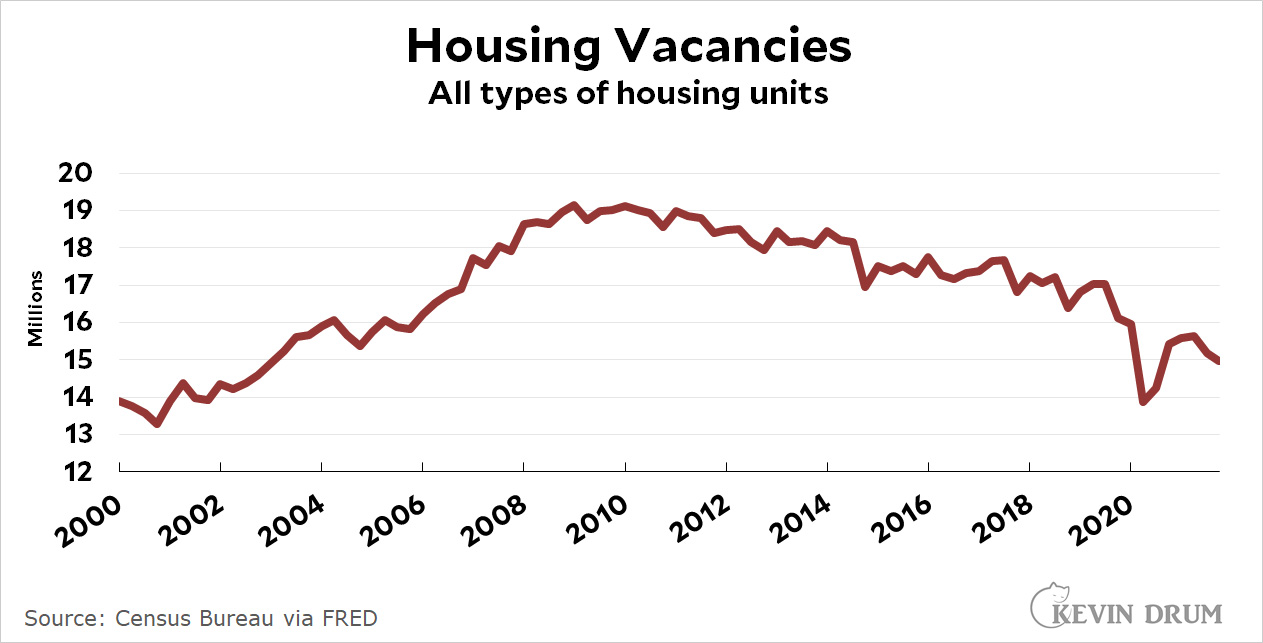 Ever since the housing bust in 2010, the number of housing vacancies has gone down. This is to be expected given the substantial overbuilding during the housing boom of the early aughts. Overall, the current decline suggests a tightening of the housing market, but only to the level of about 2005 or so.
Here is household size:
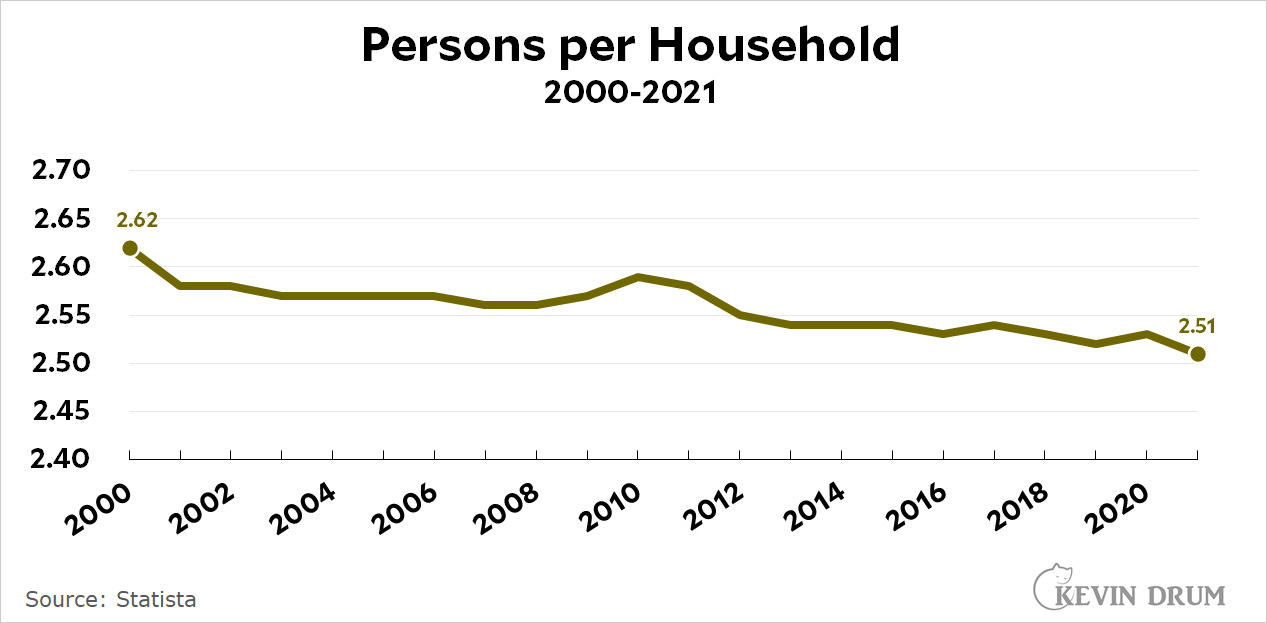 If there were a shortage of housing you'd expect to see more crowding. However, since 2000 the number of persons per household—i.e., the number of persons per housing unit—has gone down. There's less crowding now than there was 20 years ago.
Now let's take a look at housing costs. Here is housing inflation vs. overall inflation:
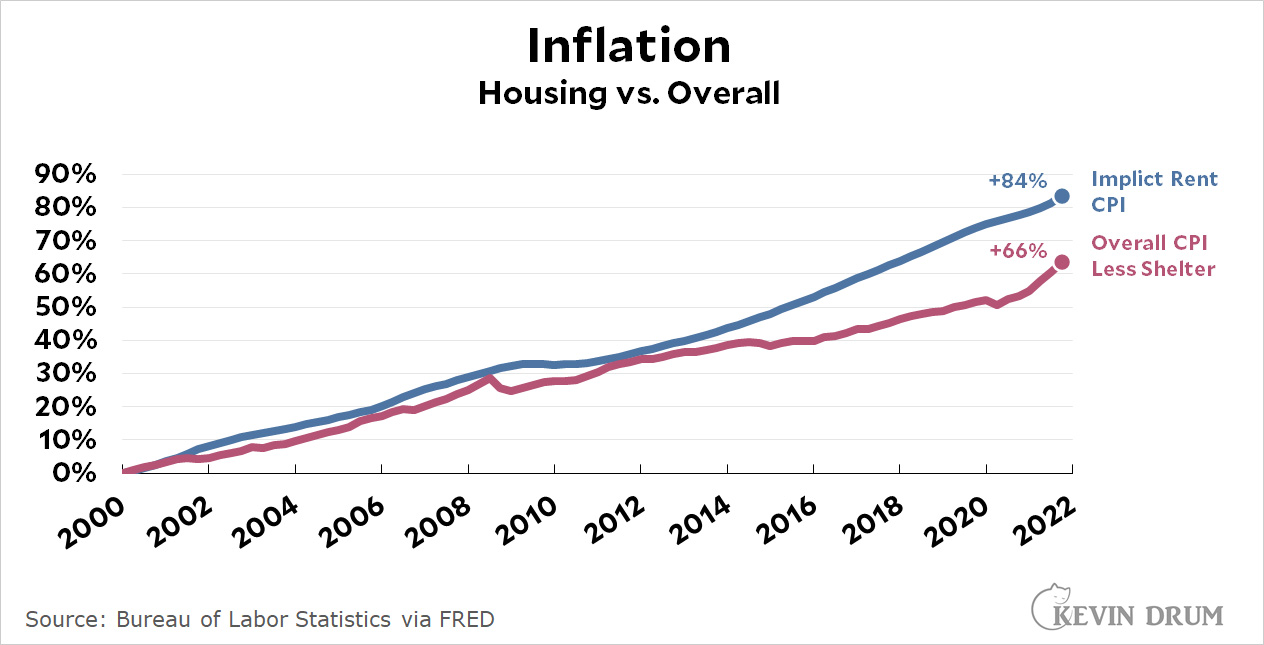 Rent has grown 11% more than overall CPI since 2000 (184 ÷ 166 = +11%). This suggests a tightening of the housing market—the rental market in particular—but note that it's a measure of inflation, not prices directly. The next two charts do that. First up is the average monthly payment for a single-family home compared to average earnings:
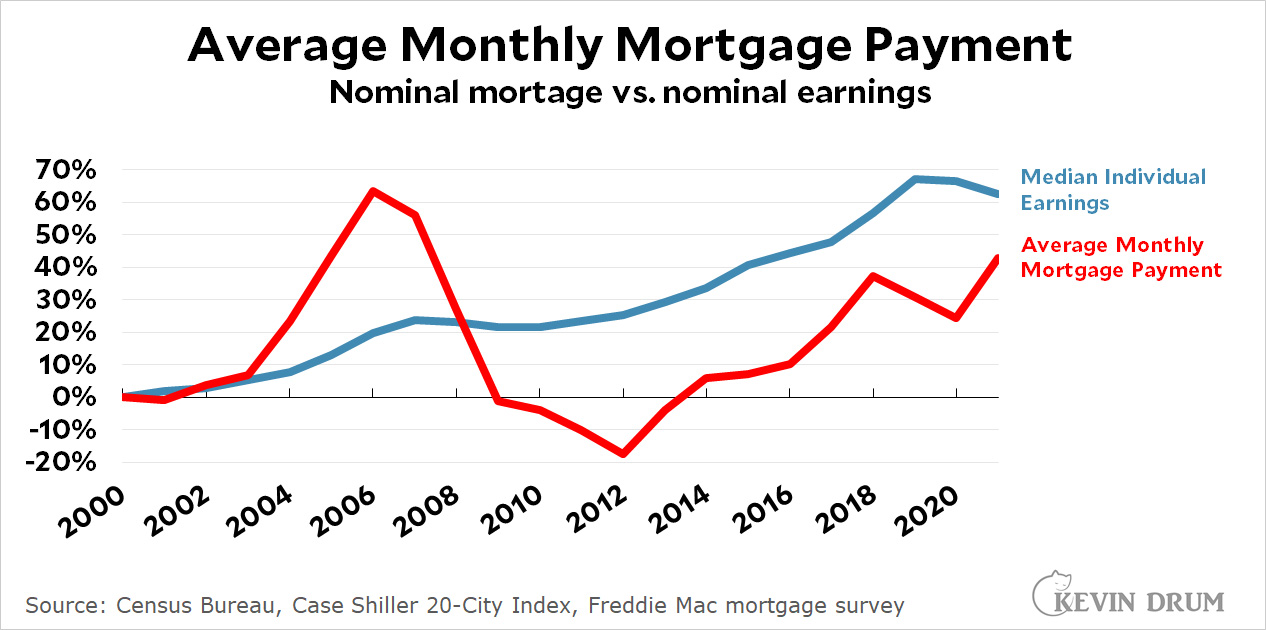 The price of homes has risen considerably since 2000, but mortgage interest rates have fallen considerably. On average, a family's monthly mortgage payment today is a smaller percentage of their income than it was in 2000.
The story is slightly different for rental housing:
 In an effort to be fair, this chart compares median rent to the median income of the 40th percentile. This is probably more representative of the income of renters than overall median income. As you can see, rent has stayed pretty steady at around 24% of income, with only small changes from year to year. Overall, there's little indication that rents have skyrocketed over the past couple of decades.
Here's the monthly supply of houses available for sale:
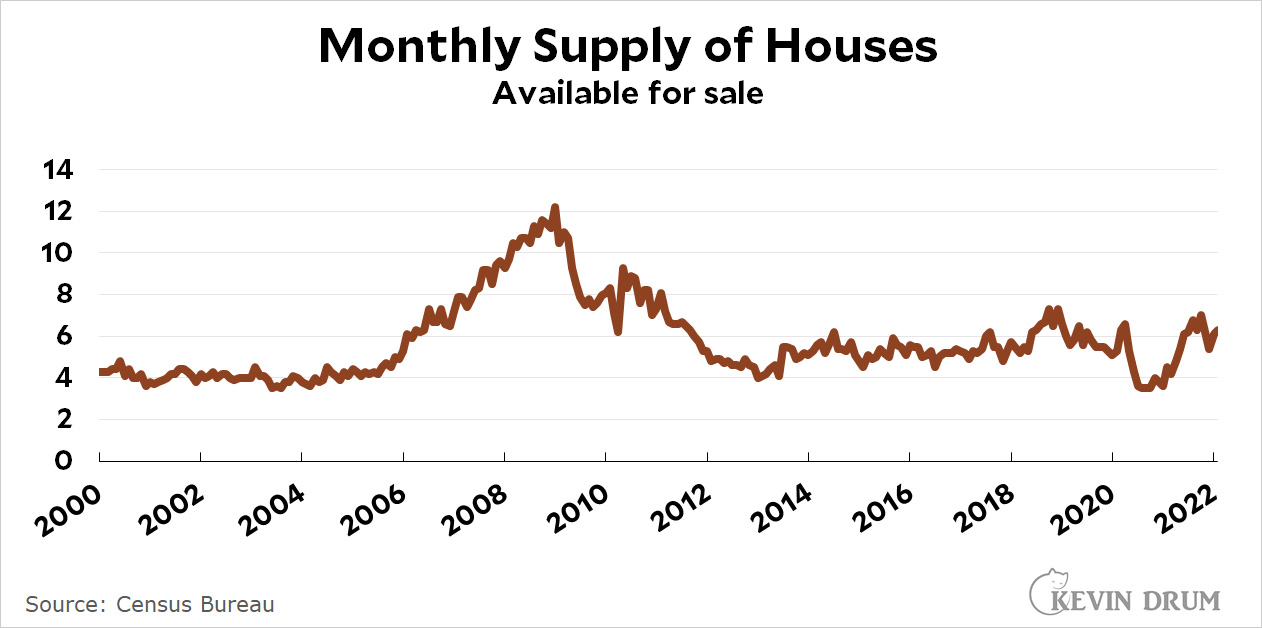 There's nothing much to see here. Housing supply has been pretty flat since 2013, and it's been flat at a slighly higher level than it was in the early aughts.
Here is the number of multi-unit apartments being built as a percentage of all housing units:
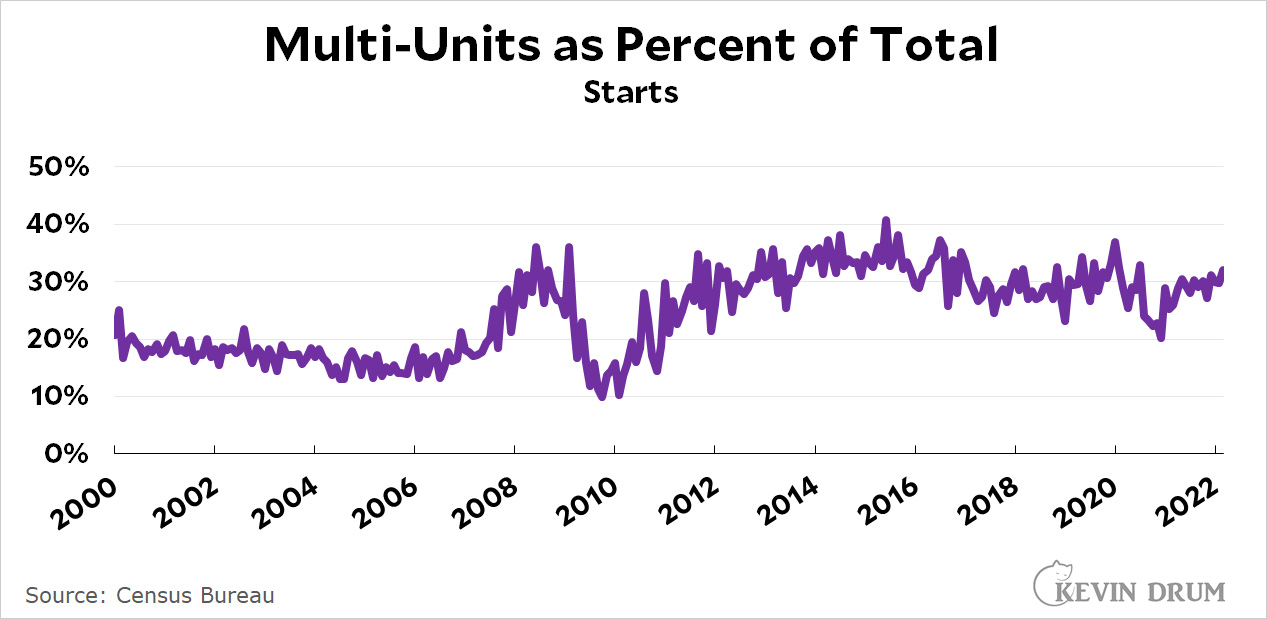 In the early aughts, multi-unit apartments accounted for only about 20% of all housing units. Today we're building denser: multi-unit apartments account for about 30% of all housing units.
Finally, this chart shows the willingness of people to move away from their current county:
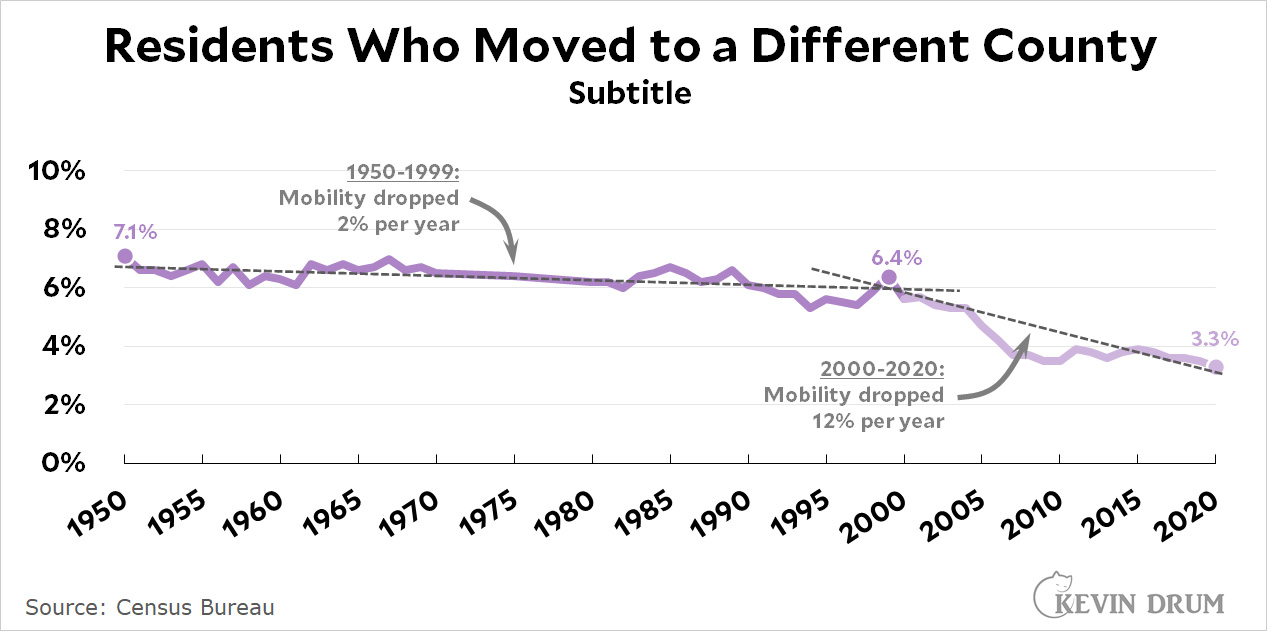 I drew this one on a longer timescale in order to show the inflection point right around the year 2000. For decades, about 6% of Americans moved from one county to another each year. Then, starting in 2000, that plummeted. Today, only about 3% of American families move each year.
For some reason, Americans are much more settled these days and far less willing to move for any reason, including things like better jobs or cheaper housing. This is new and it's something I don't really understand, but I have a feeling that among young people this might have more to do with dissatisfaction over housing than the state of housing itself. Feel free to speculate.
I promised you some discussion at the end, and here it is. First off, it's clear that nearly every metric suggests there's not a housing shortage in the US. The only two exceptions are very tiny ones: housing inflation, which is slightly higher than overall inflation, and housing vacancies, which have declined from their bubble peak—though only to about the level of 2005. Overall, it appears that we have plenty of housing.
But shortages are local! The national average may be fine but that doesn't mean there aren't shortages in individual places.
Absolutely right. California is the Great Exception and the Bay Area, in particular, is just flat-out insane. In fact, California alone might account for virtually the entire nation's housing shortage.
But beyond that there are always individual places that are popular and expensive, and there are individual neighborhoods within those places that are even more expensive. These areas change from decade to decade as different cities get hot, and there's really no way around this. This doesn't indicate a housing shortage any more than high prices for Gucci bags indicate a shortage of purses.
Why are you willing to force people to move away from the places they were raised just so you don't have to look at an apartment building near your home?
I'm not. As far as I'm concerned, you may build as many apartment buildings as you want near me. I'm not trying to prevent higher density, I'm just gathering data about the amount of housing in the United States.
But you're still a horrible boomer who managed to buy cheap and now wants to pull up the ladder behind you.
Ahem. Let me regale you with my personal housing history. Out of college, I rented a room from some friends in Tustin for a few years. They had a kid and I moved out to an apartment in Midway City with a roommate. A few years later I moved into an apartment by myself in Santa Ana. A few years after that I bought a small condo in Irvine. Finally, in the early '90s, I got married and Marian and I bought a 2,000 square foot house in Irvine, where we've lived for the past 30 years.
This is very typical. Most people can't afford either the house or the place of their dreams in their 20s, and I was very much one of those. I didn't "get in cheap"; I waited more than a decade until I had the income to buy a place in a fairly expensive area. This has nothing to do with being a boomer or a Millennial or any other generation. My parents went through the same thing, and quite probably yours did too.
But I don't want to live in Peoria or Barstow or Ft. Wayne. I want to live in a big city.
Nobody says you have to live in any of those places. However, you might have to live in Jersey or Riverside or South Elgin for a while until you can afford New York, Los Angeles, or Chicago.
But I don't want to do that.
Probably not, but this isn't a case of the world being unfair or anything like that. It's always been the case that young people have to live with roommates or live in small apartments or live in cheap areas for a while until their salaries catch up with their dreams.
This is all well and good for now, but what about 2022? Rents and house prices are going up a lot now, aren't they?
Maybe. Given the widespread use of rent moratoriums during the pandemic, it wouldn't surprise me if we saw a short-term spike in rents over this year and the next. However, we'll have to wait and see.
What about all those investors snapping up houses so the rest of us can't buy them? Isn't that killing off the housing supply?
No. Housing supply is the same regardless of who owns the homes. Besides, corporate and real estate investors buy a small fraction of all the houses sold in America. There are a few specific areas where they're very active, but that's it.
The real lesson from this trend is not that housing supply is tight, but that in certain areas starter homes are selling too cheaply and apartment rents are too high. That's why it's profitable to buy low-end homes and turn them into rentals. This suggests that in certain places there's an imbalance of what's being built and what people want, but that's likely to balance out before long.
UPDATE: Two of the charts in this post (houses per adult and inflation) have been revised based on criticism received after this was posted.