I have a big pile of charts to show you. Don't worry, though, they'll go pretty quickly.
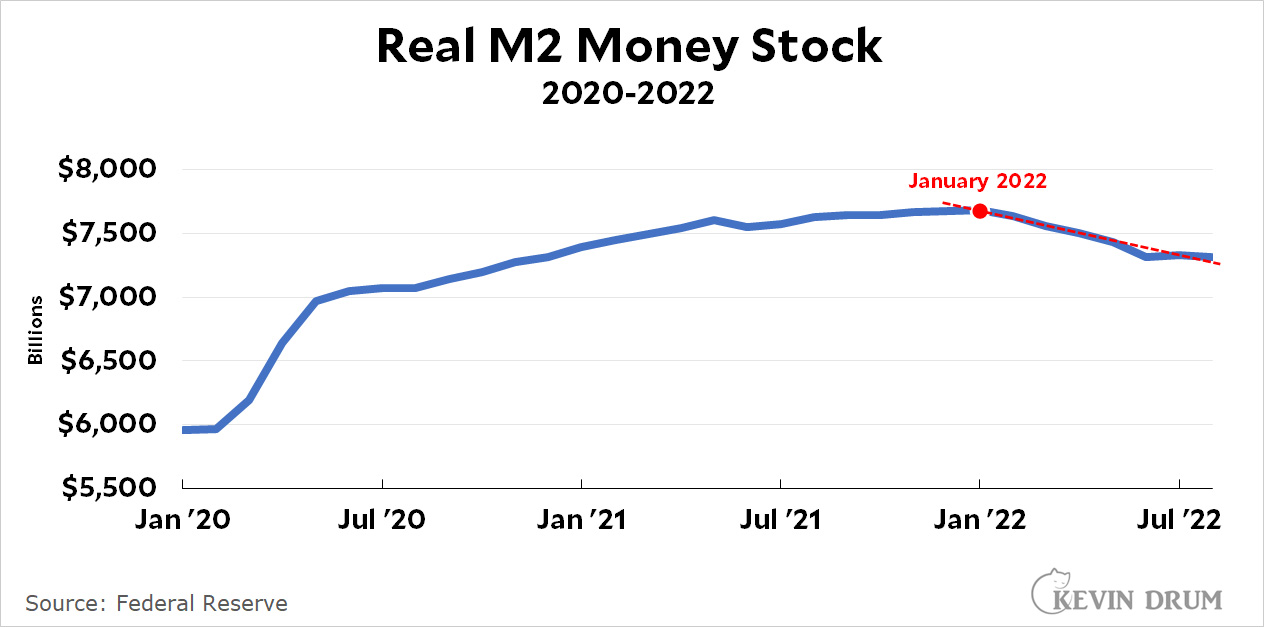
The first is the M2 money supply. It spiked upward after the $3.2 trillion COVID rescue bill was passed in March 2020, and then continued growing. But in January it peaked and has been falling ever since:
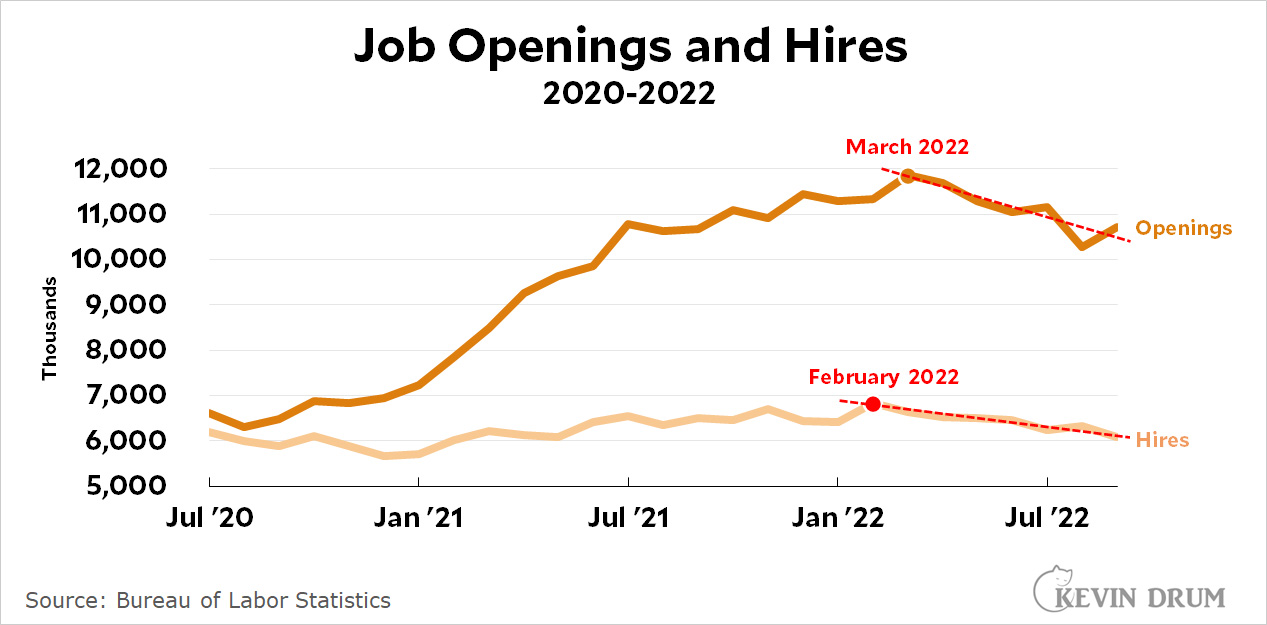
 Next is both the number of job openings and the actual number of new hires. These metrics were rising until early this year. Then they peaked and they've been declining ever since:
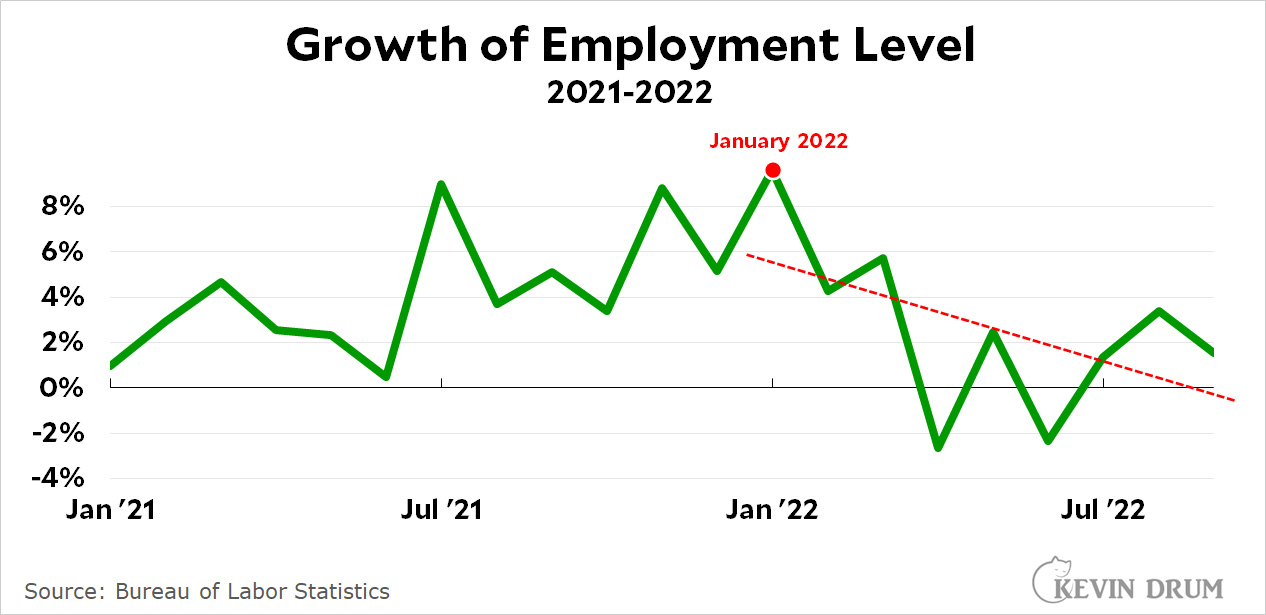
 You are probably sensing a trend. Next up is a related measure, the growth of the employment level. It too was growing until January, at which point it started to drop at a fairly dramatic rate:
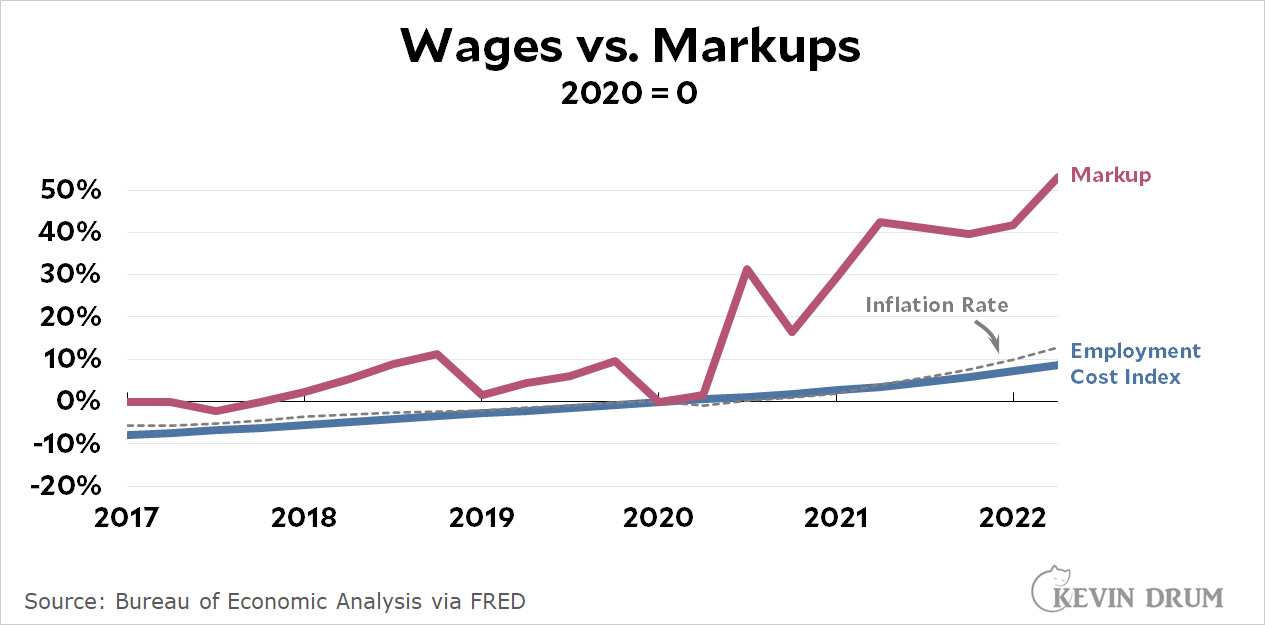
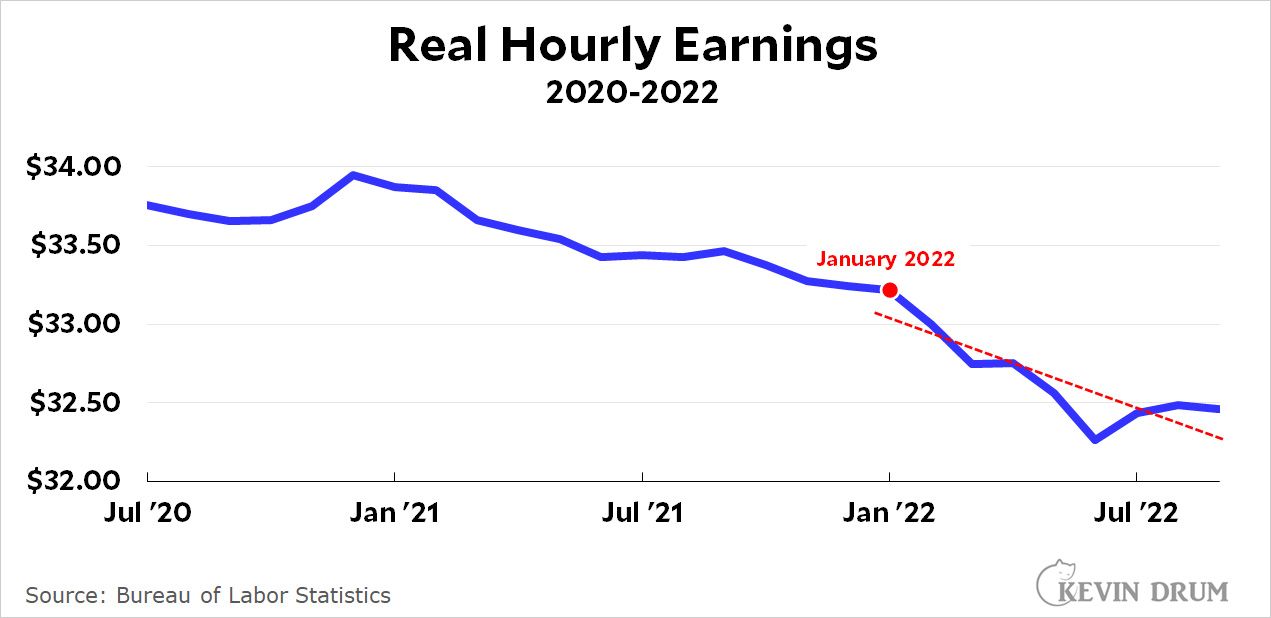
 Next let's look at hourly earnings. They've been dropping ever since early 2021, but in January of this year they started to really drop:
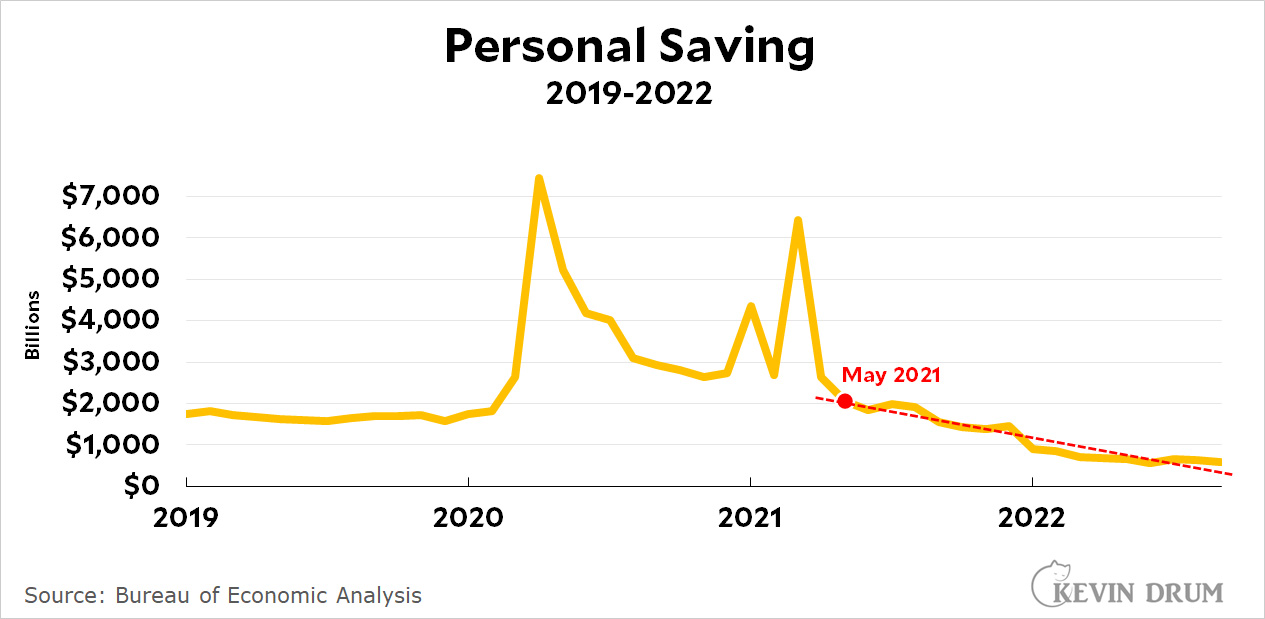
 Next is personal savings. Savings spiked after each stimulus bill, the last of which was passed in March of 2021. Savings were back down to normal by May and have been declining ever since:
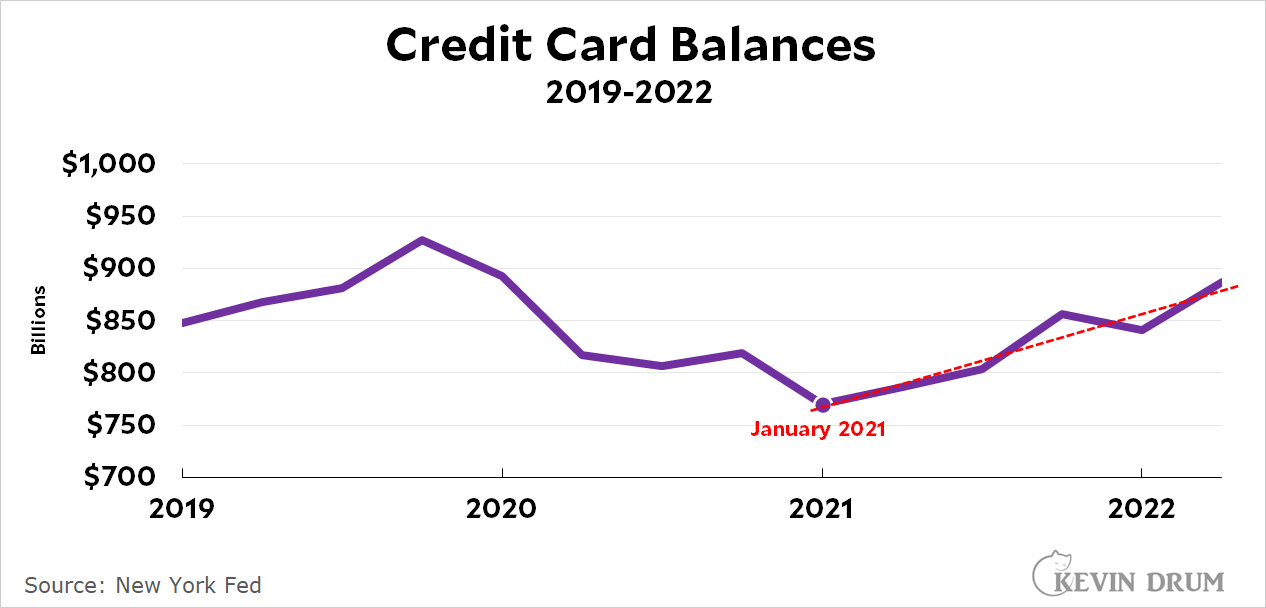
 Next is credit card balances. In January 2021 they suddenly started to go up, a signal that people are making ends meet only by putting purchases on plastic as wages begin to dry up:
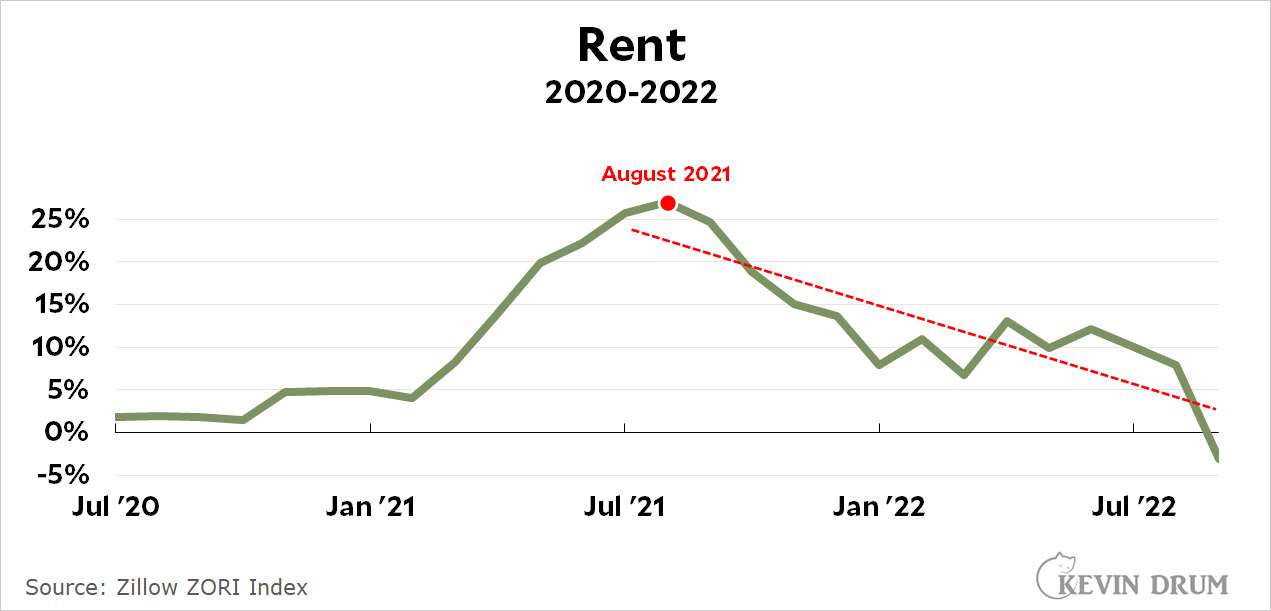
 Finally we have average rents, which rose considerably in the first half of 2021. However, the growth rate of rents has been dropping ever since August 2021, and last month the growth rate was negative:
 All of these things are either inflation precursors (M2 money, employment) or actual elements of inflation (wages, rent). All of them have been falling since the start of the year, and some of have been falling even longer.
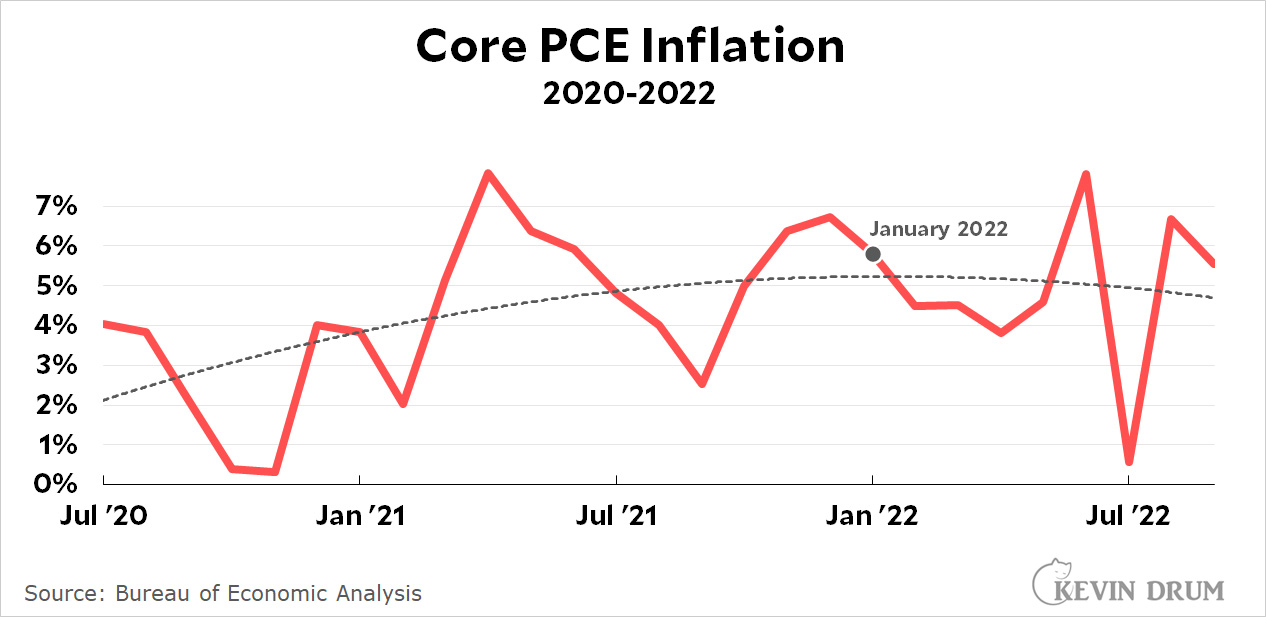
None of them affect the inflation rate immediately. They all have lags. The M2 money supply takes about a year to affect inflation, while others have an impact in less time. This is why inflation peaked in January and is already dropping:
 By the end of the year pretty much everything related to the inflation rate will finally be having an impact. But all of them started long before the Fed began raising interest rates.
This pisses me off. Inflation will be under control by the start of 2023 and will continue to drop throughout the year. This will happen after four or five big interest rate jumps, and people will therefore hail the Fed for conquering inflation. Like this from NPR today:
The Federal Reserve ordered another big boost in interest rates on Wednesday....The rate, which was near zero in March, has jumped 3.75 percentage points in the last eight months. That's the most aggressive string of rate hikes in decades, but so far it's done little to curb inflation.
"Interest rates have risen at a whiplash-inducing speed, and we're not done yet," said Greg McBride, chief financial analyst at Bankrate. "It's going to take some time for inflation to come down from these lofty levels, even once we do start to see some improvement."
The implication here is that we need more and more rate increases, but it's not true. Like everything else, increases in the fed funds rate have a lag—probably of at least six months and maybe as much as a year. It's true that the Fed's recent increases haven't had an effect, but that's not because the Fed hasn't done enough of them. It's because they simply haven't had time to have any effect.
In other words, whatever happens in January of 2023 will have nothing to do with the Fed and everything to do with other things that started dropping in 2021 and early 2022.
By the middle of 2023 I suspect we'll be firmly into a recession thanks to those interest rate increases. And that recession will come at the worst possible time, just as inflation is reined in and the economy has cooled of its own accord. We won't want that recession by then, but we'll get it anyway thanks to Jerome Powell.
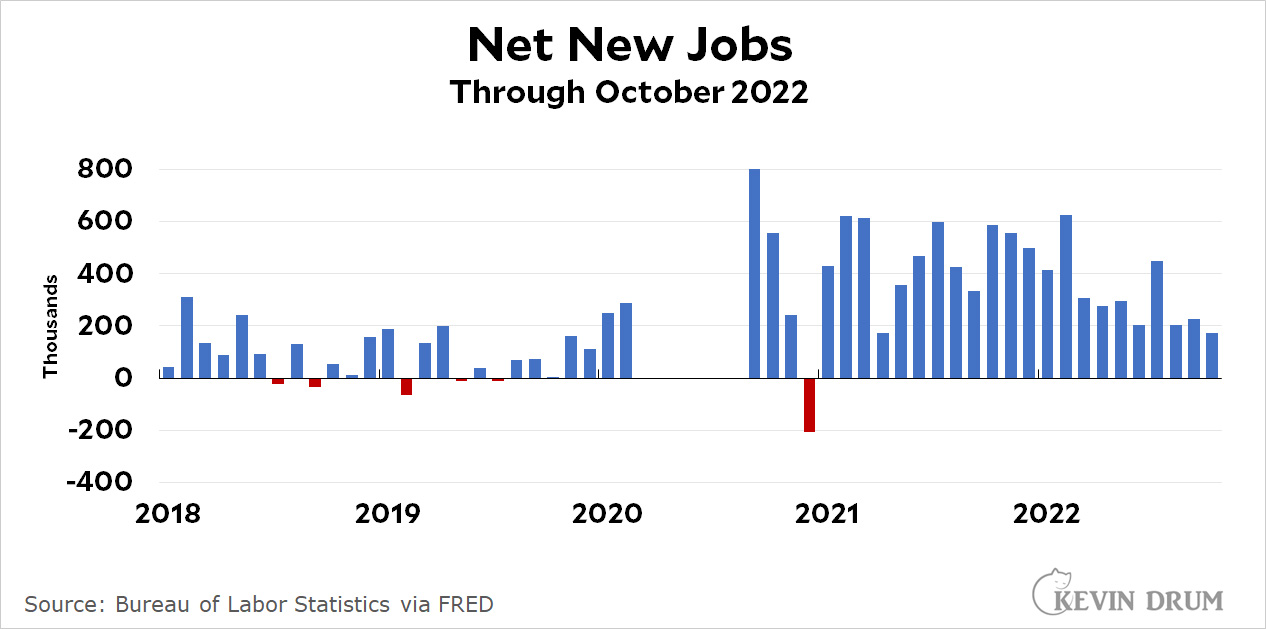 This is a respectable report, but the bad news is that about 300,000 people left employment and entered the unemployment roles. That's why the unemployment rate went up from 3.5% to 3.7%. Almost all of that came from people losing their jobs or finishing up temporary gigs. None of it came from voluntary leavers.
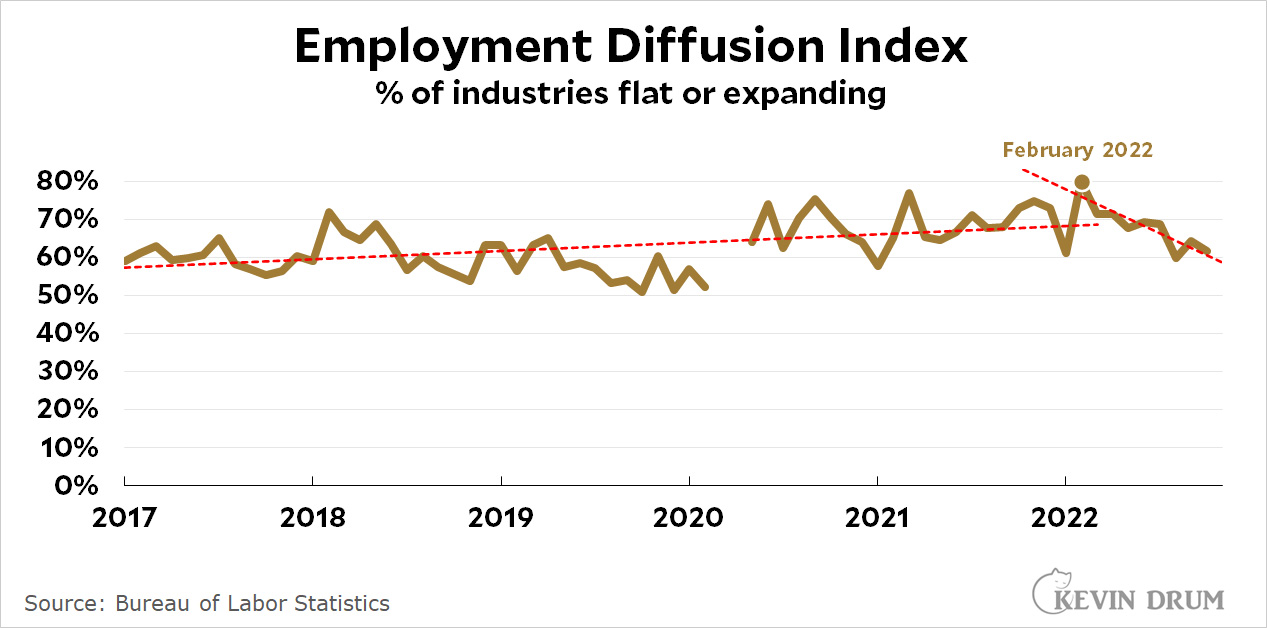 This is a measure of the percentage of industries that are expanding. It includes all industries that are hiring more workers + half the industries that are flat. The latest figure is 62%, which is good, but not as good as it was last year. As with so many other metrics, it peaked early in 2022 and has been dropping ever since. This is a sign that employment is not as robust as we think. More on that later.