Over at Vox they're writing about "A Crisis on American Roads." Part 1 is mostly about a mother whose daughter was killed in a crosswalk in Washington DC by the driver of a van. The rest of the piece claims that the increase in vans and big SUVs is responsible for our recent increase in pedestrian deaths.
I don't find that implausible at all, but I nonetheless wanted some evidence. Finally, after plowing through 2,000 words (!) I got it. But my spidey sense began to tingle when I saw this:
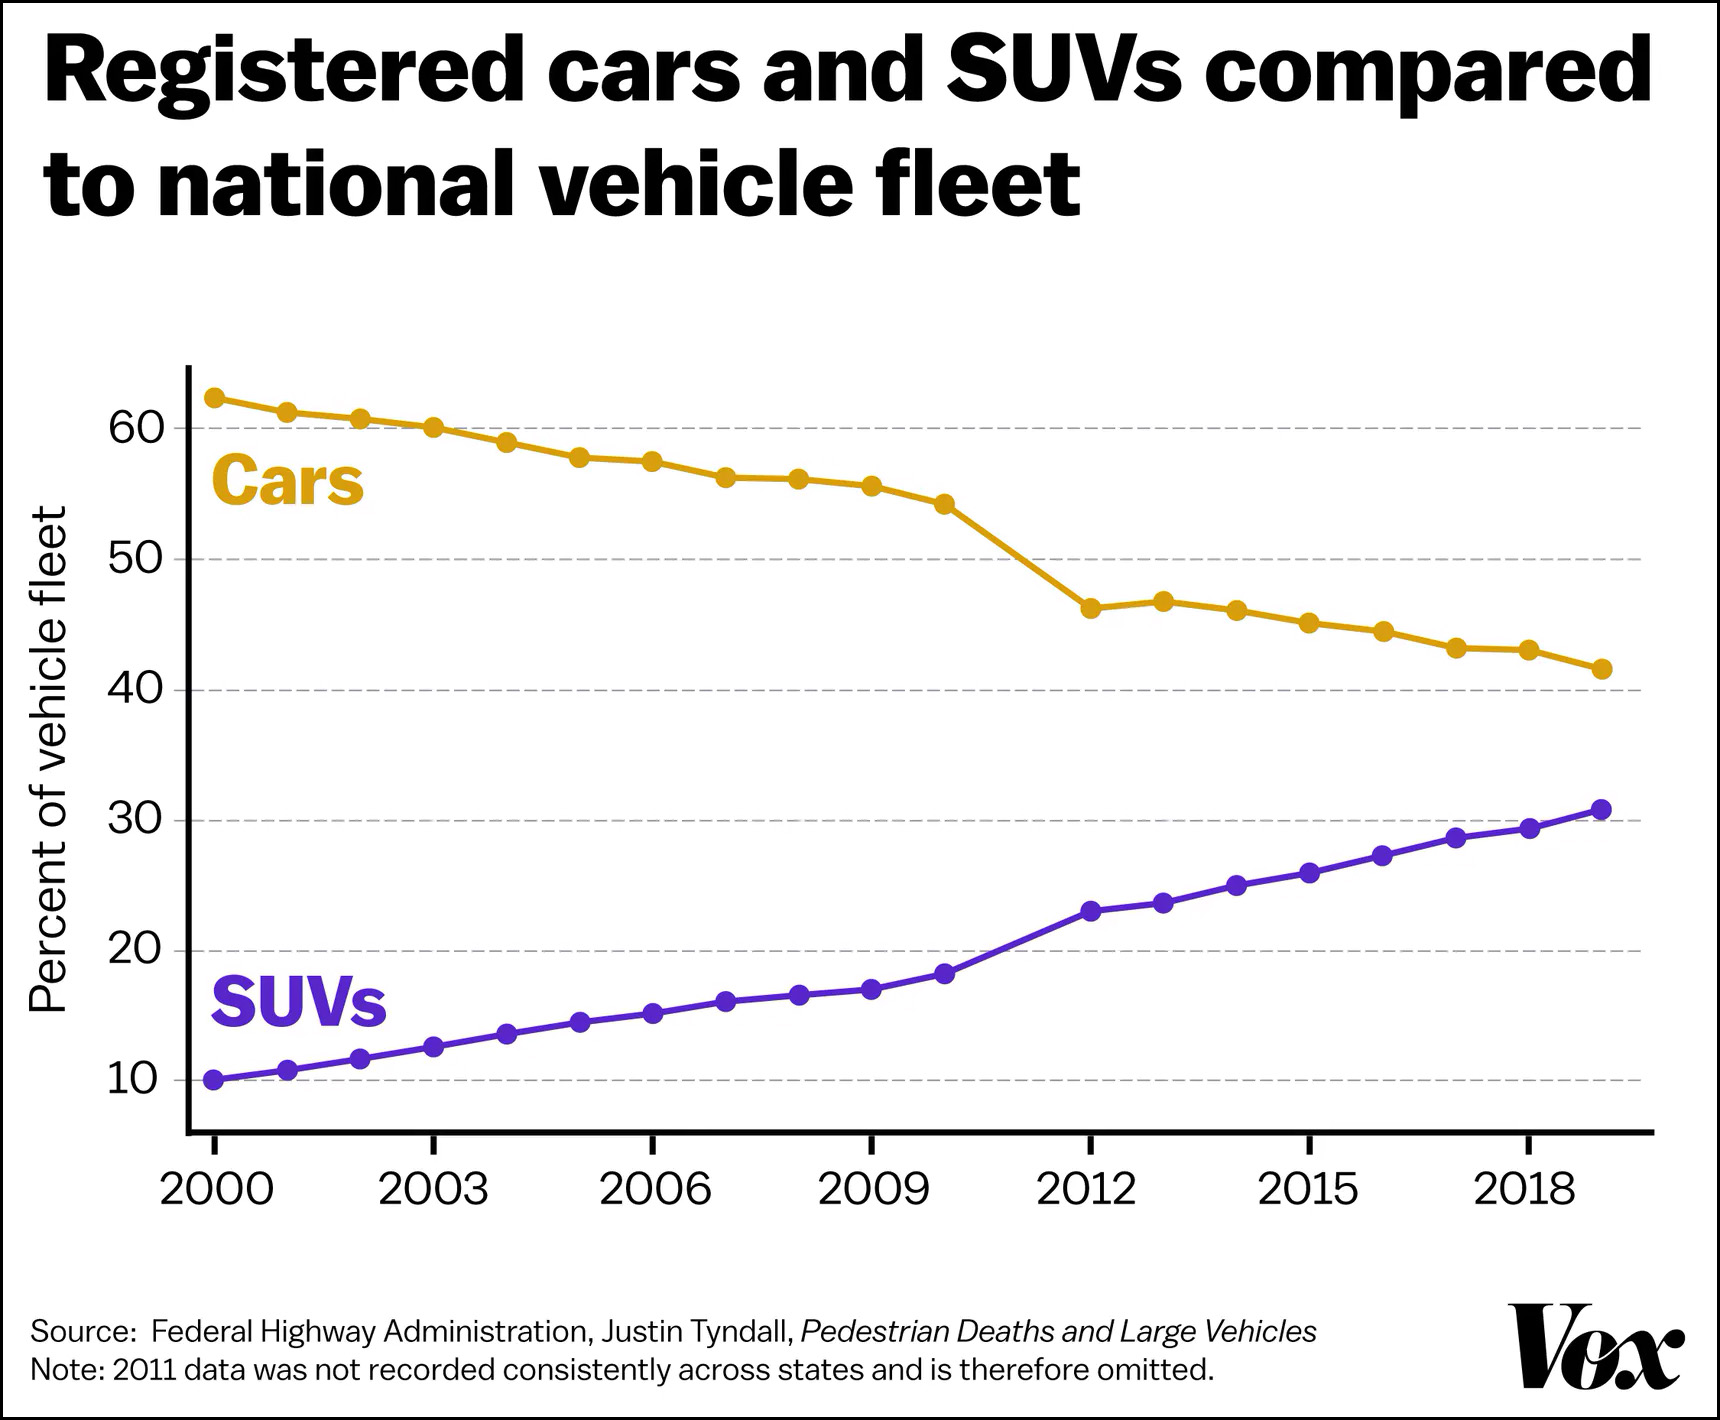 There are two weird things here. First, were SUVs really only 10% of all vehicles on the road in 2000? That seems awfully low compared to my memory of that period. Second, there's no line even trying to compare the growth rate of SUVs to the growth of pedestrian deaths. That seems like an odd omission.
You know the rest of the story: I decided to collect the best statistics I could find and draw a similar chart. See the footnote for details.¹ Here's what I came up with:
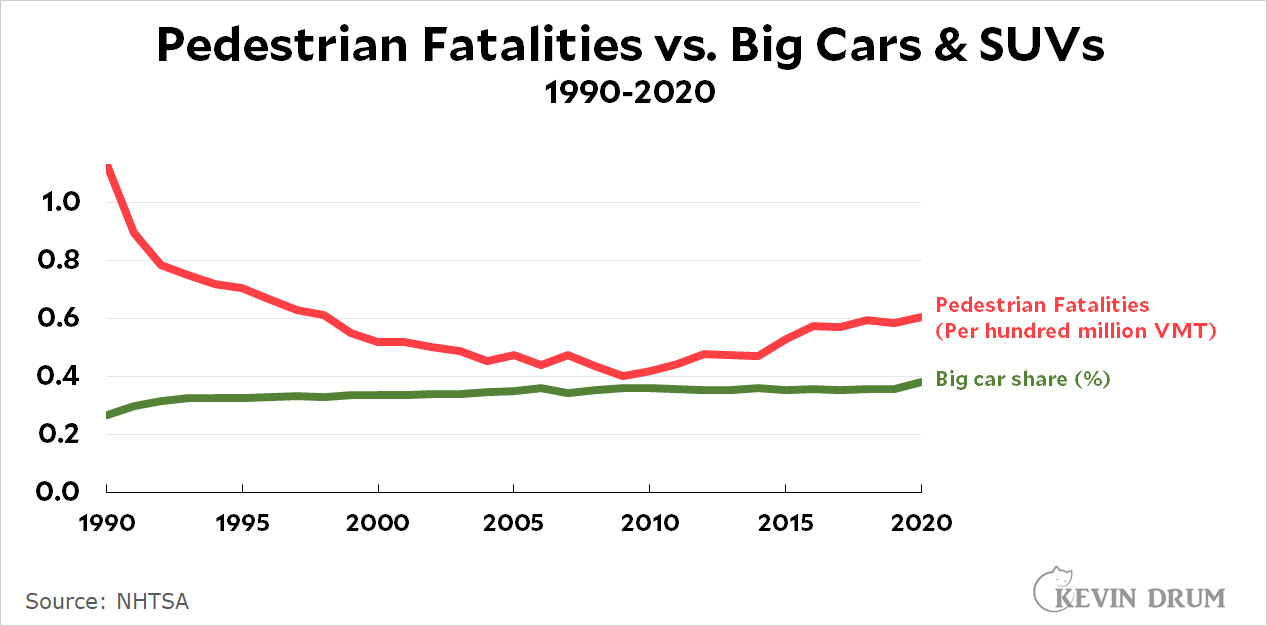 What you see here is, first, a huge drop in pedestrian fatalities from 1990-2010. (The decline actually began around 1970, but I didn't use those figures in the chart.) Second, there's a slow rise from 2010 to the present.
The share of big cars, however, shows nothing like this. It just goes up slowly and steadily for the entire period from 1990-2020. There's really no correlation here.
Why did pedestrian deaths go down from 1970-2010? Safety enhancement in cars certainly played a role in reducing fatalities among drivers and passengers, but not among pedestrians. Nor has anything new happened since 2010 that would cause pedestrian fatalities to go up significantly (about 50% over a single decade).
None of this is positive proof that big cars aren't at fault in recently rising pedestrian deaths. But it does mean we should be skeptical and demand better evidence. The Vox article provides two studies on the subject. The first is 20 years old and shows that light trucks and vans are more dangerous than passenger cars. No argument there. I think we can all agree on that much.
The second study is very recent and compares pedestrian death rates in different cities. It concludes, "If all [emphasis mine] light trucks were replaced with cars, over 8,000 pedestrian deaths would have been averted between 2000 and 2019." That's about 400 deaths per year. In a real-world situation in which we didn't eliminate every single light truck on the road, but instead produced a 12% reduction in order to return to the 2000 average, this comes to about 50 deaths per year, or a reduction of around 1%. That's not a meaningful result.
So: are big SUVs and light trucks responsible for our tsunami of pedestrian deaths? I doubt it. But pedestrian fatalities did suddenly spike up starting around 2010. Something else must have changed then, but it's not obvious to me what it is. However, I do have a guess:
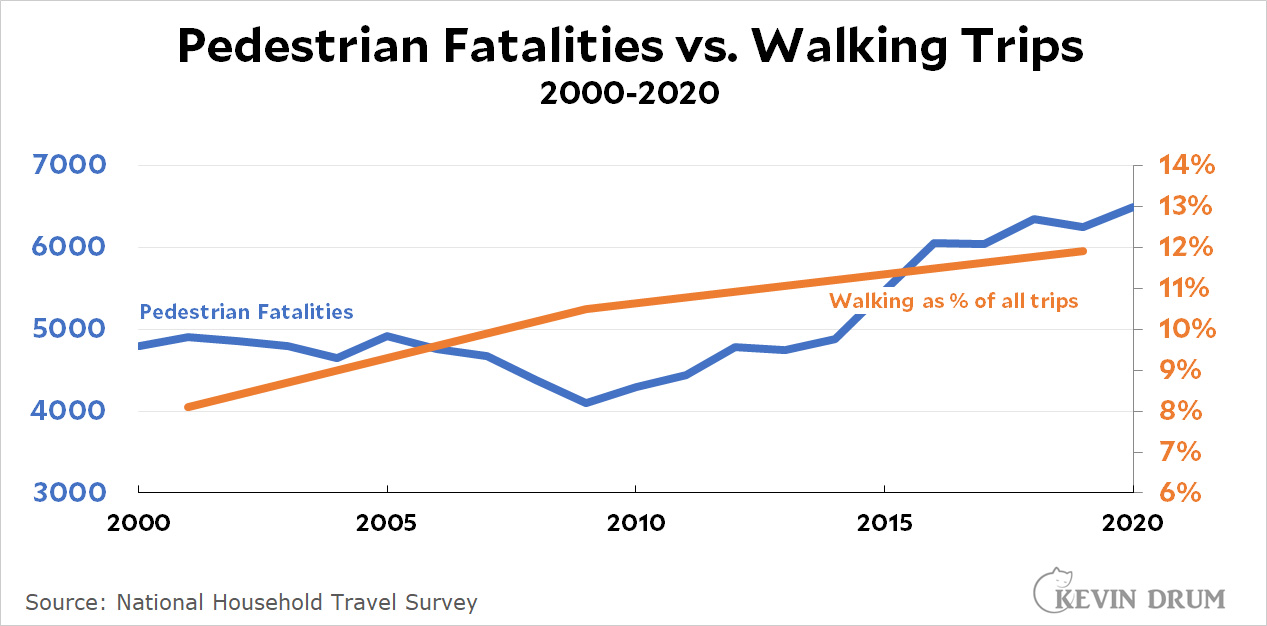 This is not great data. It comes from the National Household Travel Survey, which is conducted about once a decade. It doesn't tell us total miles walked or anything useful like that, and the fit is not impressive. Still it does show that we're walking more: about 35% more since 2000.² Don't take this as more than a suggestion, but it certainly makes sense that if people are walking more, there are going to be more walking accidents. It might not have anything to do with cars and drivers at all.
Then again, there's also this:
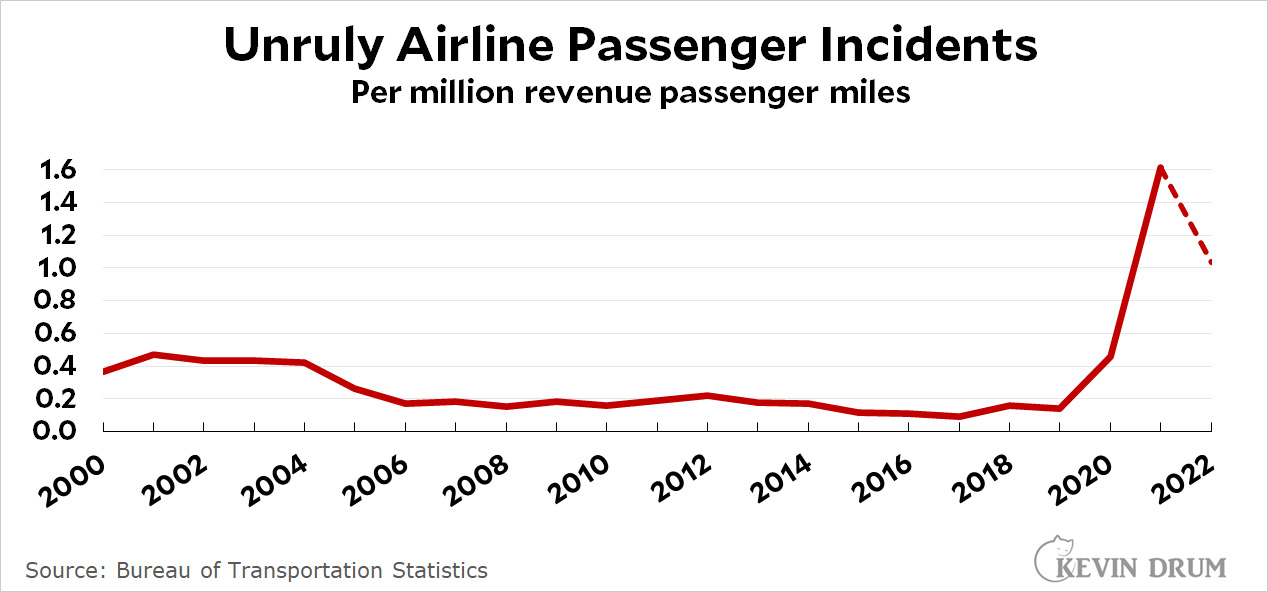
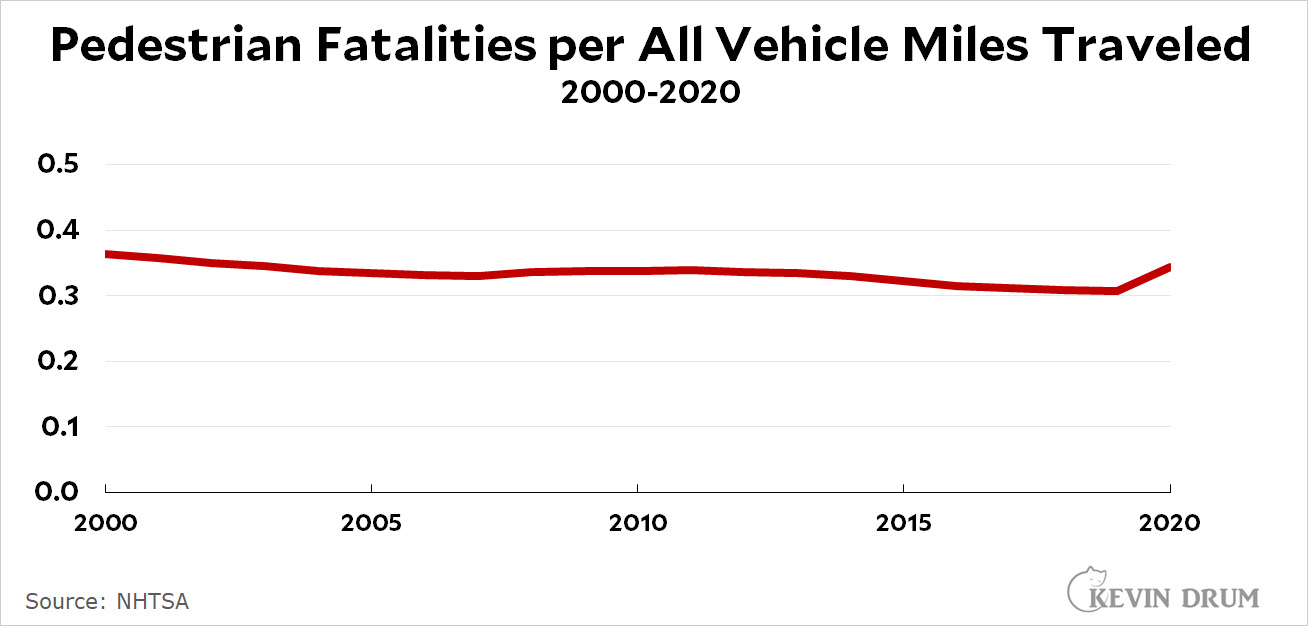 Forget big cars and small cars. Forget about how much people are walking. Instead just look at something plain and simple: the number of pedestrian deaths per million vehicle miles. All vehicle miles. It turns out that our streets have gotten steadily more crowded (by about 20% since 2000), and when you adjust for that crowding the number of pedestrian fatalities has gone down, not up.
Maybe we're overthinking this. Maybe there was no crisis to begin with.
¹The NHTSA doesn't track "SUVs." The closest it comes is "Light duty vehicle, long wheel-base." which includes large passenger cars, vans, pickup trucks, and sport/utility vehicles with wheelbases longer than 121 inches.
So that's what I used. Unfortunately, this category was invented in 2007 and produced a huge discontinuity in the data. For example, vehicle miles driven dropped from 1.1 billion in 2006 to 0.6 billion in 2007 because certain vehicle categories were switched into the short-wheelbase group. I had no choice but to do some sketchy interpolation, but I doubt it introduced more than a modest amount of error.
As for the data itself, vehicle miles driven is here. Pedestrian fatalities from 1927-1989 are here. Fatalities from 1990-2005 are here. Fatalities from 2006-2020 are from the FARS database. The middle set of years is from the Governor's Highway Safety Association. The other two are from the NHTSA.
²This is all well and good, but does the amount of walking account for the drop in pedestrian deaths from 1970-2010? Did we walk a lot less during those years? Sadly, we don't have any data for that. For now it remains a mystery.
 Here's a full frame crop of the same picture. Both of these were taken with my camera, not my telescope.