Yesterday I ran across an item about the high murder rate in Washington DC. I also happened to remember this, based on the research of Marc Edwards:
 Beginning in the year 2000, Washington DC experienced an episode of lead contamination in its drinking water that wasn't discovered until 2004. For five years, DC's kids were drinking water with highly elevated levels of lead.
I adjusted the lead numbers so they'd nicely overlay the DC murder rate with a 20-year lag.¹ Here's what it looks like:
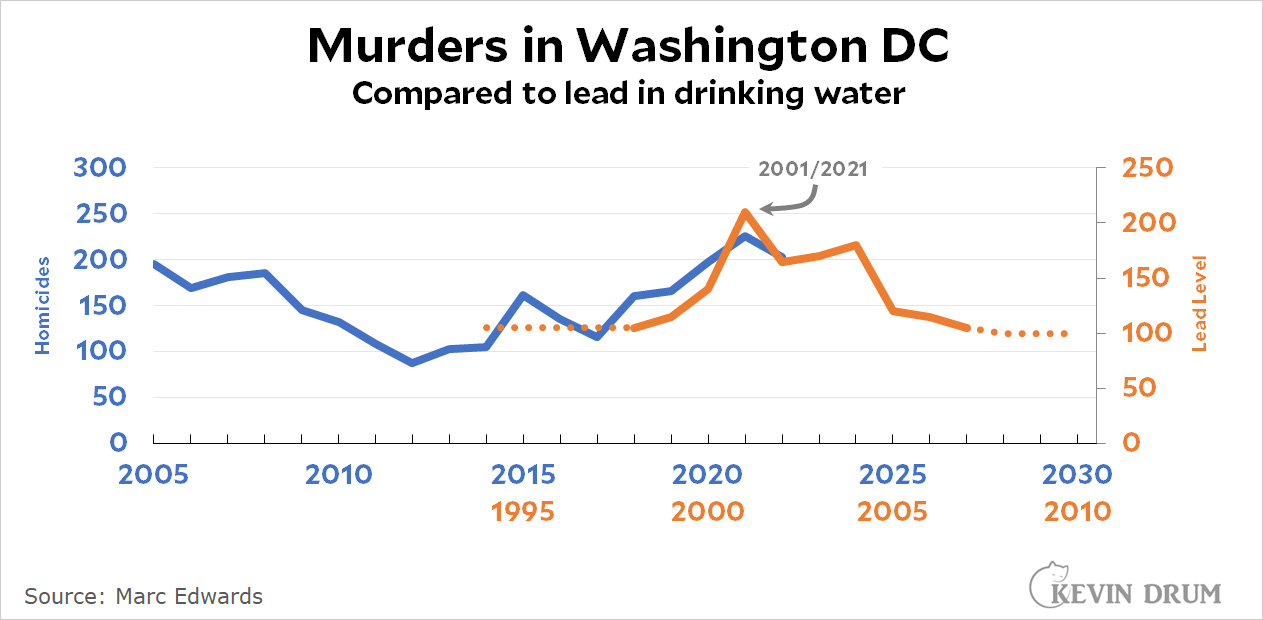 Crime has lots of causes—and correlations like this one are especially tricky in small regions over short periods of time—but it's interesting nonetheless, isn't it? It sure looks like the lead crisis of 2000-2004 produced a cohort of kids 20 years later who are more likely than usual to commit murders.
¹I shifted the lead levels up by 100 and squeezed them slightly. It's all kosher and produces a normal correlation equation. I did this solely to make everything visually clearer.
NOTE: I'd like to check lead levels vs. the violent crime rate, but (a) the FBI's violent crime figures only go through 2020 before becoming unreliable, and (b) NCVS doesn't track crime in individual states and cities. So the DC murder rate is the best I can do.

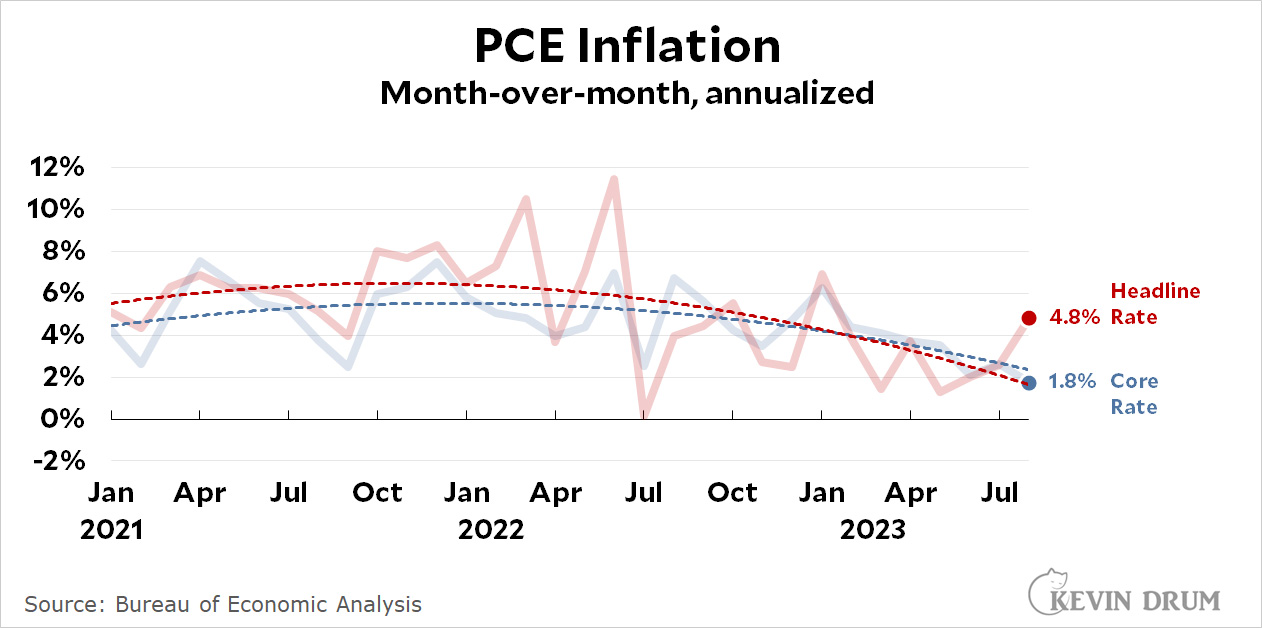
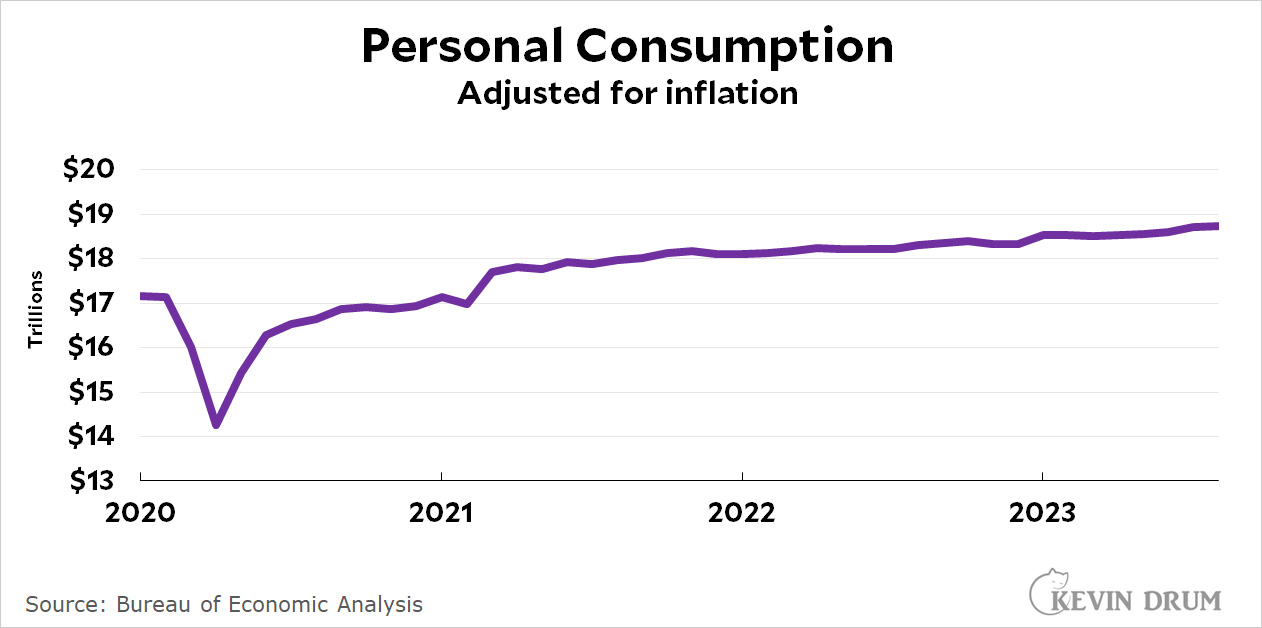 Spending was up 0.6% from the previous month on an annualized basis. It was up 2.3% from the previous year.