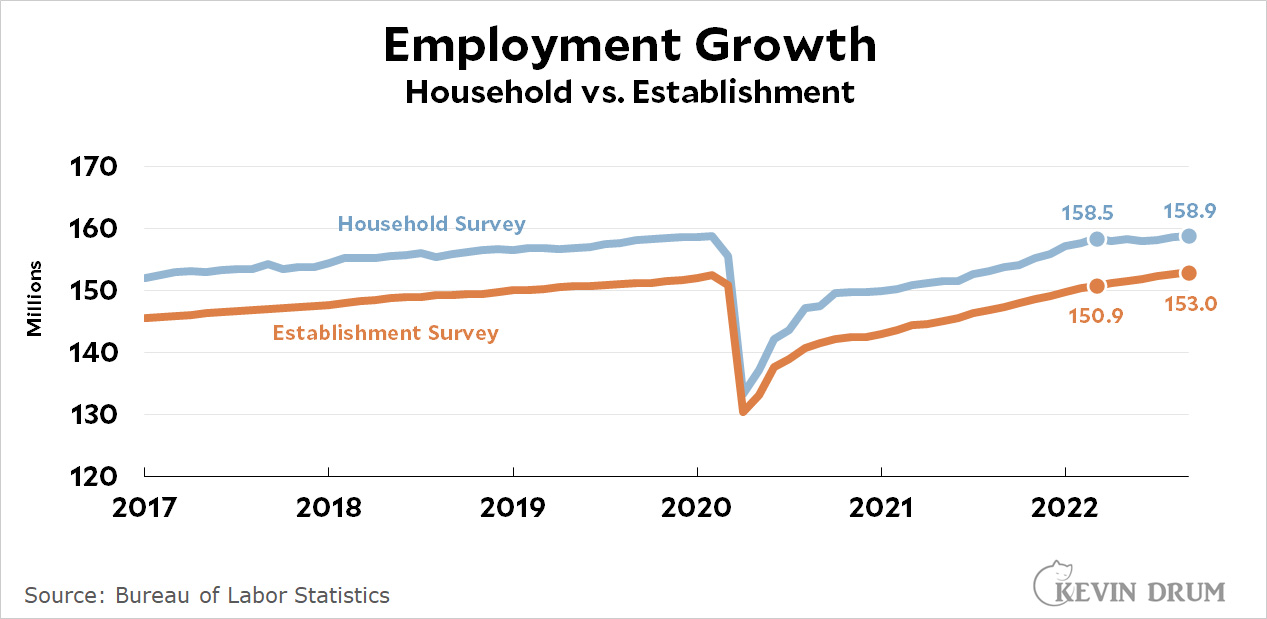
I've mentioned this before, but the divergence between the establishment and household surveys of employment has continued to grow:
Over the past six months, the establishment survey says that employment has grown by 2.1 million, or 350,000 per month. This is the headline number reported every month.
Conversely, the household survey says that employment has grown by 0.4 million, or 70,000 per month.
The absolute level of employment is not at issue here. The household survey uses a broader definition of employment and is always higher than the establishment survey. However, the growth rate of the two is generally about the same, as you'd expect.
Except for now. Over the past six months the household survey shows a far slower rate of employment growth than the establishment survey. If it's the more accurate one at the moment it would explain a lot of the weirdness of the recent economy, which seems to have mediocre overall performance but gangbusters job growth. Maybe there's no mystery at all, though. Maybe everything is pretty mediocre right now.
I think of this as the Parisian mod squad. I took this picture while I was randomly clicking away at lunch at the Place de la Bataille de Stalingrad. After lunch we grabbed a couple of eclairs from a local bakery and then got ourselves tested for COVID-19. Busy day.
Of course not. This phrase is used constantly for a nearly endless number of subjects. It could be anything.
So how about if we knock it off? If you're talking about, say, a KKK resurgence, it's fine because it's relevant. If you're talking about almost anything else, it's not. It's just a bit of cheap racial and sexual ridicule tossed in to get your liberal audience nodding along. Let's give it a rest.
Is crime up these days? Or is it down? What kind of crime, anyway?
You would be surprised how hard this question is to answer. On a national level, crime statistics take a year to compile so they're always way out of date. To make things worse, the FBI recently changed its crime-reporting process and lots of police departments have just decided not to bother with it. And then, to make things worse still, crime went up and down during the pandemic in ways that are very hard to account for.
What this means, basically, is that I wouldn't take recent crime data very seriously. There's no way to guarantee any kind of accurate comparison between years and it will probably be 2024 or 2025 before things settle down and we once again have numbers we can rely on.¹
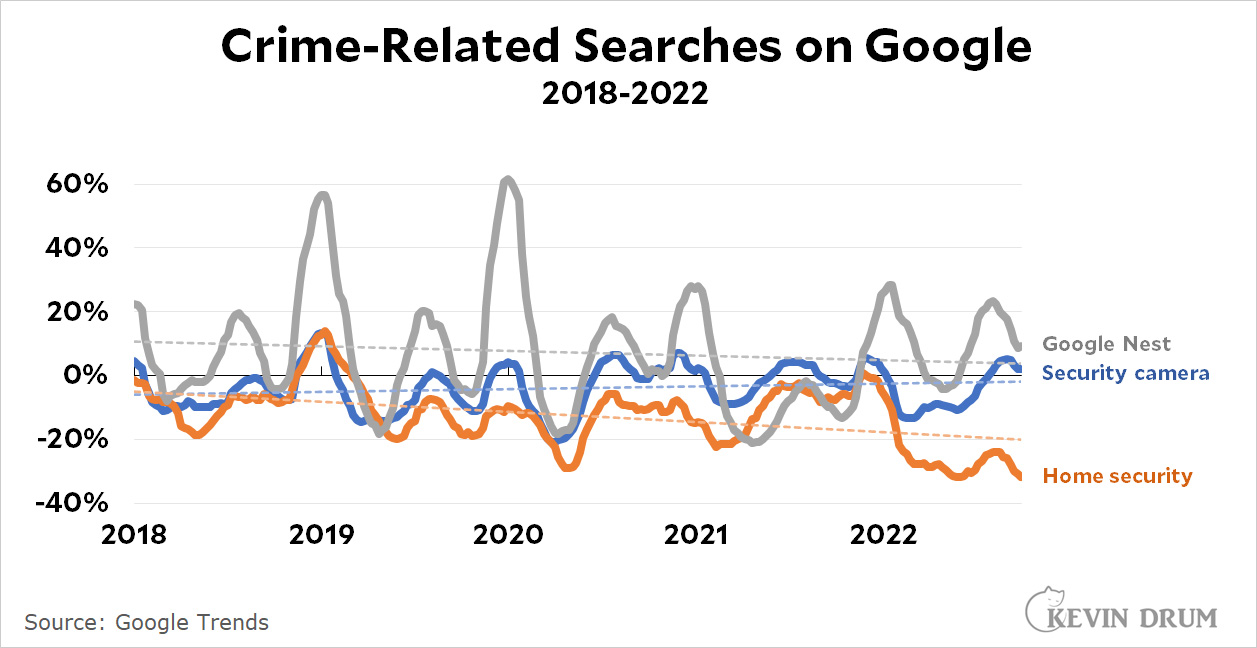
But that got me curious. What about fear of crime? There are polls that ask about this, but it occurred to me to wonder what people actually do when they get concerned about rising crime in their neighborhoods. Answer: they think about buying some kind of security equipment. So how has that gone over the past few years?
This is Google Trends data for three different search topics that people might search for if they're afraid of local crime. As you can see, they all have peaks around the holiday season and around Google Prime Days. This is presumably caused by people who either buy or receive this stuff as gifts and are googling to find out how to use it.
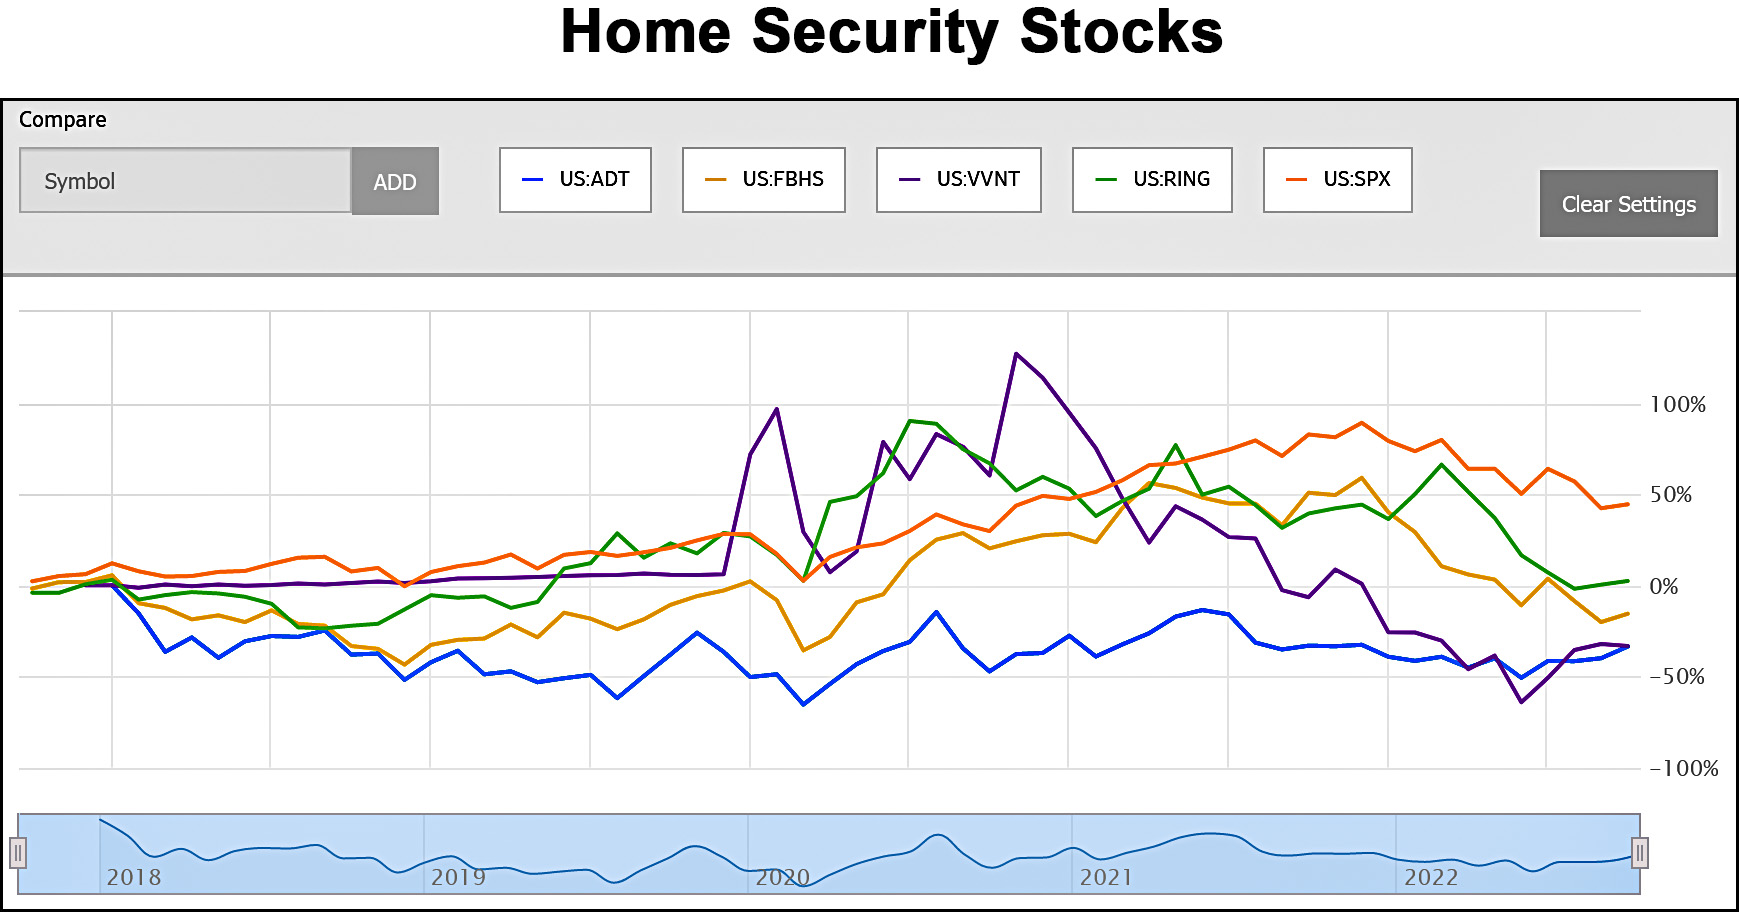
However, once I've smoothed out the lines a bit and added trendlines, the conclusion is pretty obvious: on a national level, fear of crime is either flat or going down. There's no sign at all that people are increasingly interested in security equipment. This shows up in the value of home security companies too:
There's nothing very impressive here. If the home security business is booming, you sure can't tell it from the performance of large public companies that specialize in it.
Now, this obviously has limited applicability. I had trouble coming up with generic search terms and I might have missed some large home security companies. But I didn't cherry pick anything here. I just did my best. If you want to suggest other search terms or companies, let me know in comments. Just remember: the object is to come up with things that people might search for if they're afraid of local crime, not just crime reports on cable news.
¹There's local crime data from cities like New York and Los Angeles that's fairly up to date, but you still have to be careful with it. For one thing, it only applies to a single place, but it's also the case that different cities report crime categories differently. If you look at local stats, be very, very careful that you know what you're looking at.
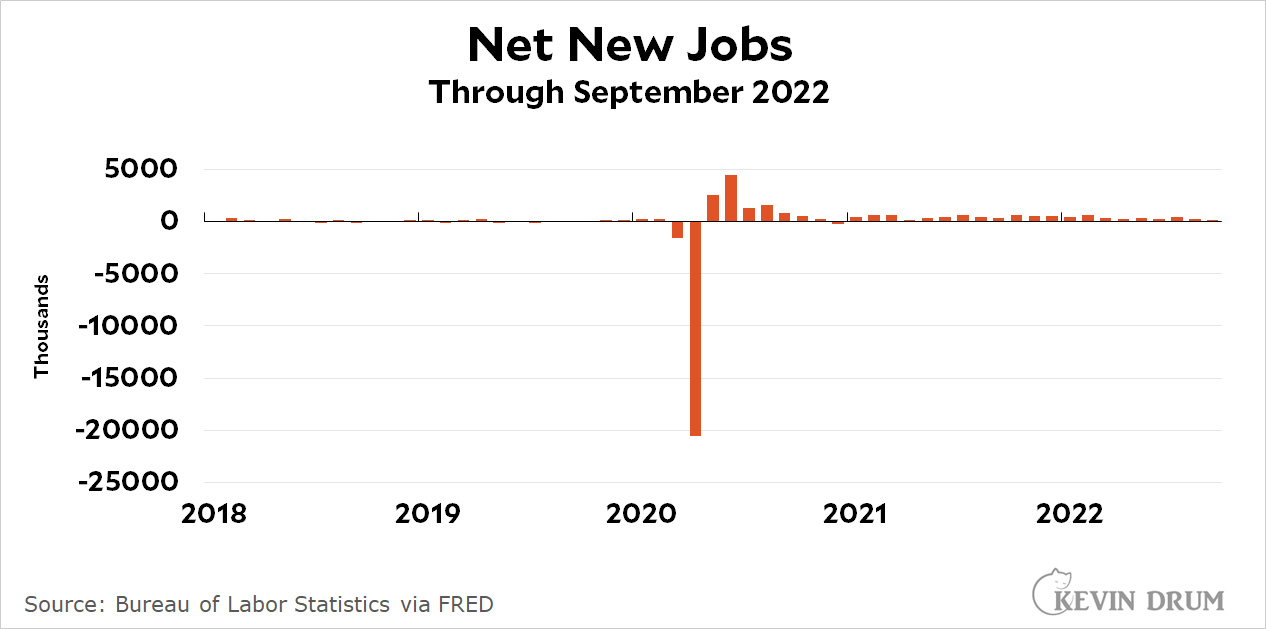
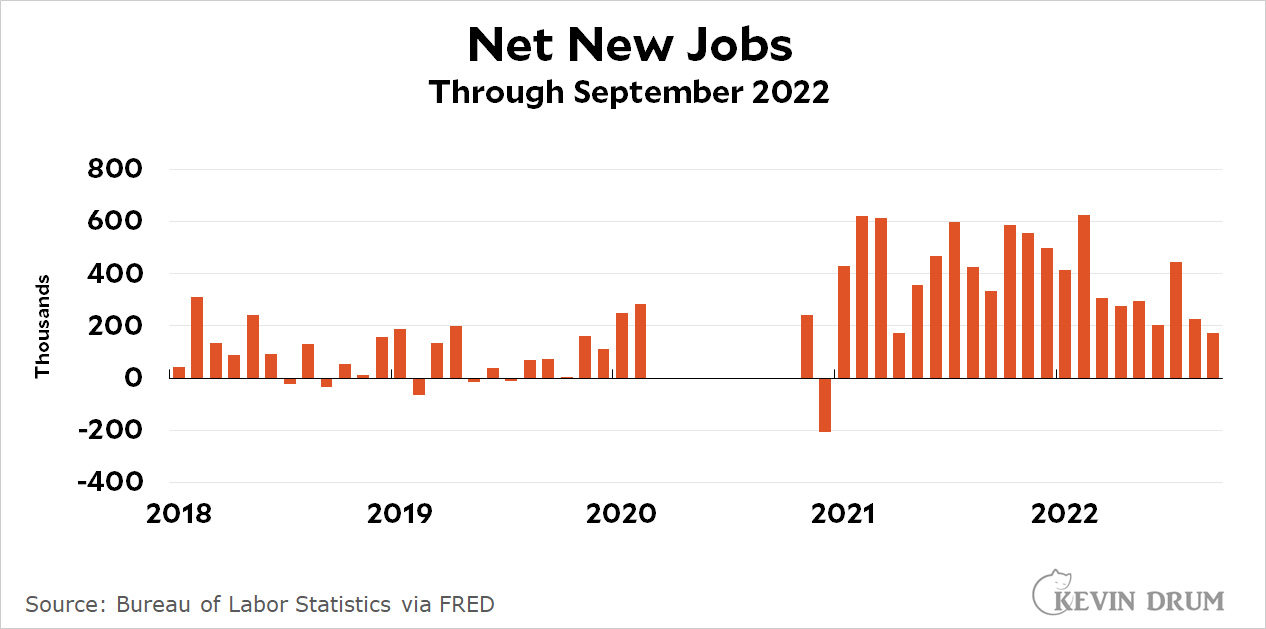
Why, a reader wonders, did my Friday chart about job gains have a big chunk of it blanked out? That's easy to explain with a quick comparison of three different ways of presenting the data.
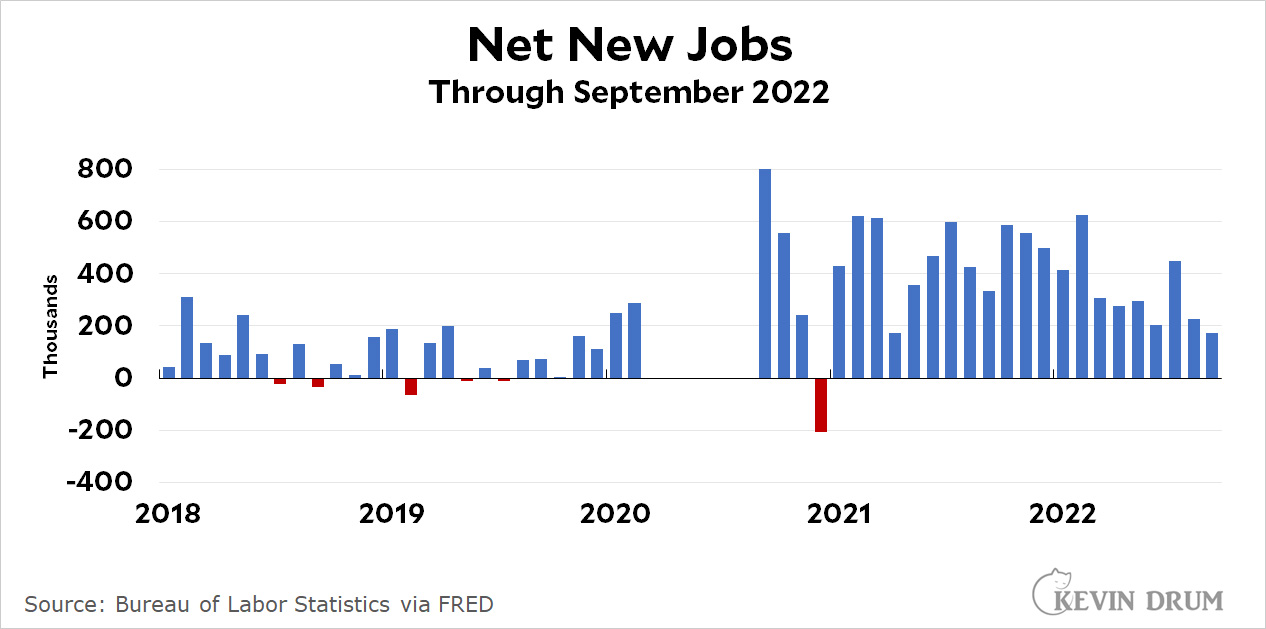
Here is Chart #1, which is what you'd think of as the default presentation. Just set the y-axis to fit all the data and go:
The problem is obvious: we had a huge surge of job losses and gains at the beginning of the pandemic. If you set the y-axis to fit those outliers, the rest of the data is useless. You can barely tell if the numbers are up or down in recent months.
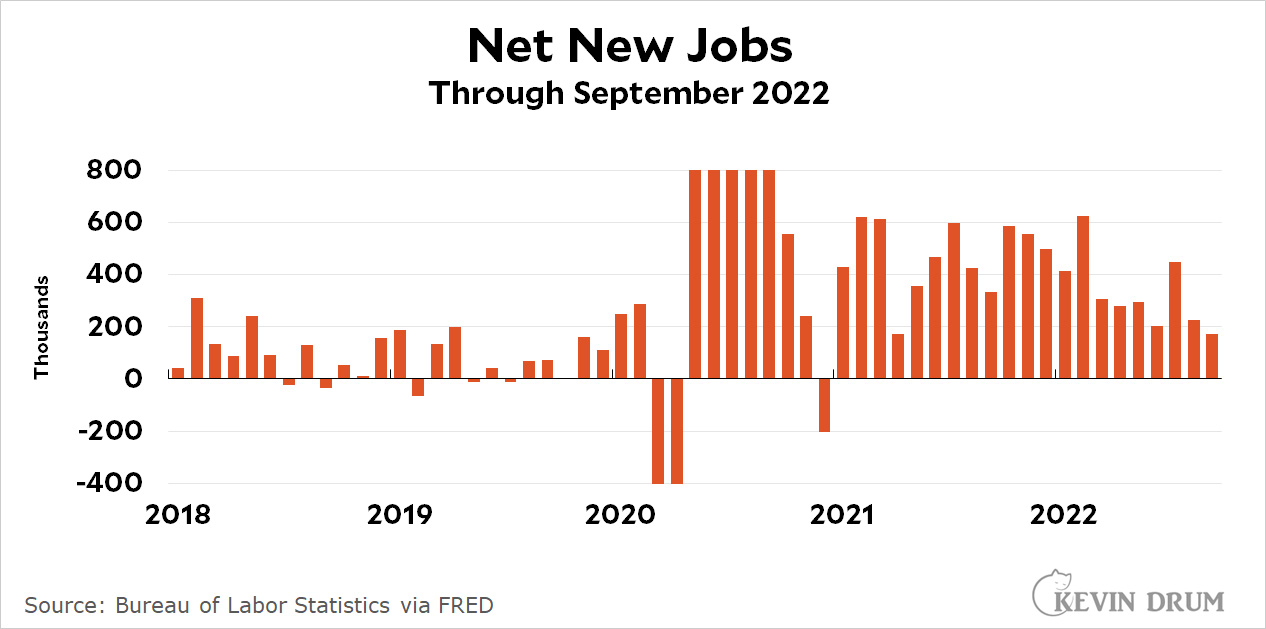
So here is Chart #2. We'll reset the y-axis so that it does a better job of presenting all the normal data:
This is better, especially since we don't really care that much about the pandemic data that spills off the top and bottom of the chart. However, since those bars don't provide any information, why even bother to show them?
So here is Chart #3. It's same as #2 except that the pandemic bars are removed:
There aren't really any other options. A log chart would work except for two things: (a) most people don't understand log charts, and (b) log charts don't work if you have negative data—which we do.
In some cases you could use little slashes to show, say, a jump from 1000 to 5000. That wouldn't work here because there are too many outlier values at different levels. Also, my charting software doesn't do this automatically and it's a pain in the ass to do it manually. I would never bother with this unless it were really important.
So that's that. You can decide for yourself which presentation is best, but I've chosen to use #3 routinely when I have to deal with enormous data outliers from the start of the pandemic.
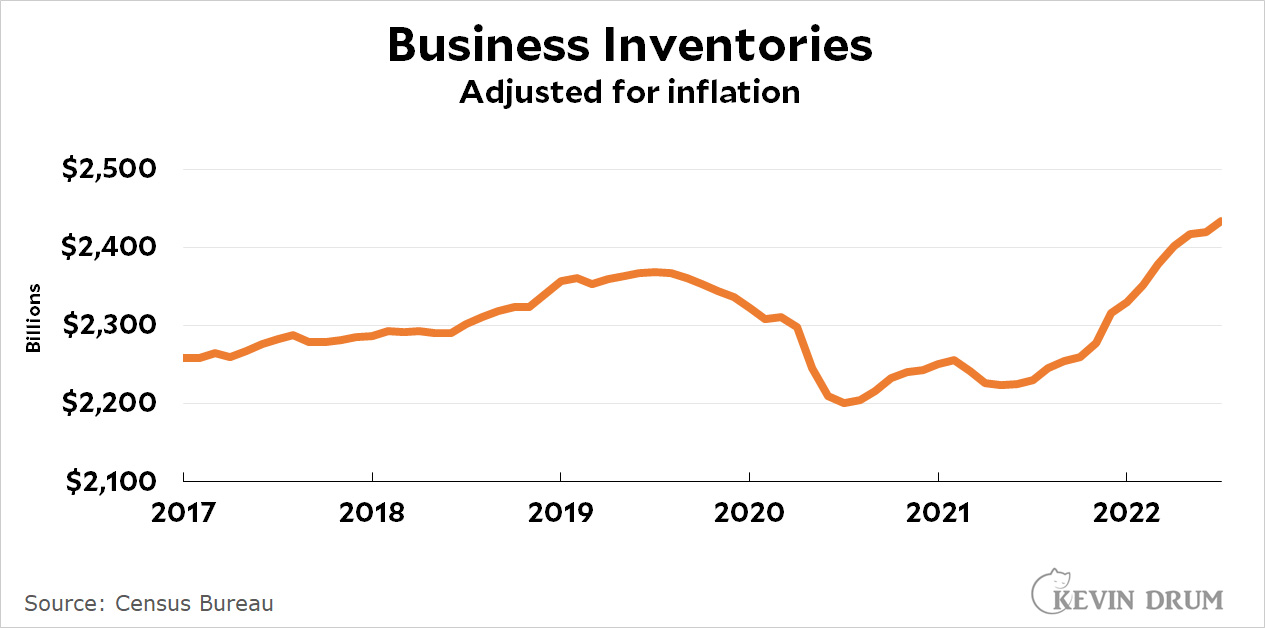
The average contract prices for the two major types of memory, called DRAM and NAND flash, dropped by 15% and 28% respectively from the prior quarter during the July-to-September period, according to TrendForce, a Taiwan-based market researcher. Prices for both types of memory chips are expected to decline on a quarterly basis in the fourth quarter and all of next year, as excess inventory builds up, TrendForce estimates.
Prices are flattening or even dropping on lots of key commodities. And business inventories are getting swollen:
Real retail sales have been flat for more than a year and have been declining since May. I wouldn't say the economy is in terrible shape right now, but it sure doesn't seem like it's running hot. And it's running a little less hot with every passing month, weakening inflation naturally as it goes.
Charlie has discovered the bird bath. This reminds me of Hopper, who jumped into the bird bath every morning to slurp up a little bit of protein smoothie to start her day.
Yesterday Charlie discovered our squirrel. Not discovered, really, but he finally decided to chase it around. I was looking out the window in the morning and saw our squirrel running along the top of the fence. Then, a moment later, I saw Charlie running along the fence in hot pursuit. I have a feeling he'll be in for a big surprise if he ever catches up.
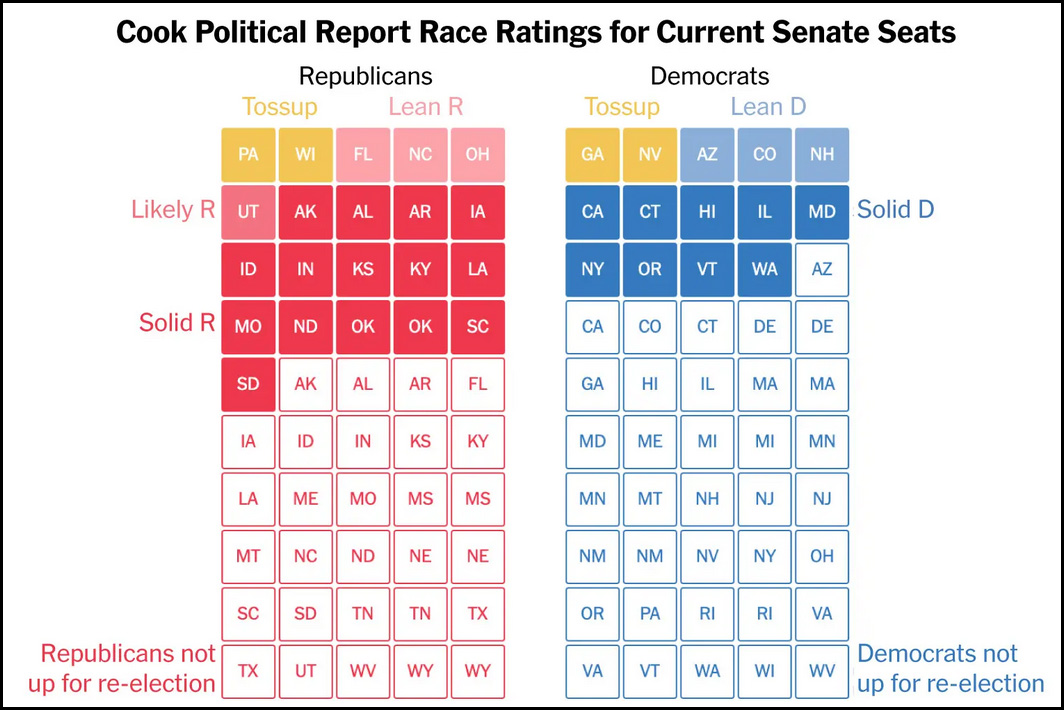
If we take the leaners seriously, it means there are only four real Senate races in the entire country. Democrats have merely to beat Dr. Oz in Pennsylvania and Herschel Walker in Georgia and they remain in control of the Senate. The other two toss-up states are tougher: Wisconsin's seat is currently held by incumbent Ron Johnson, while Nevada's Adam Laxalt is political royalty as the son of Pete Domenici and grandson of Paul Laxalt. He's also a MAGA nutter, but that may or may not be a negative among Nevada voters.
So that's that. With less than a month to go, there are basically only four seats still in serious competition, and Republicans are surging in all of them. Democrats have their work cut out for them over the next four weeks.
The American economy gained 263,000 jobs last month. We need 90,000 new jobs just to keep up with population growth, which means that net job growth clocked in at 173,000 jobs. The headline unemployment rate edged back down to 3.5%.
This is a pretty mediocre jobs report—although that depends on how you look at things. In terms of raw numbers, it's so-so. On the other hand, given the state of the economy it's not so bad.
In the details, 261,000 workers exited unemployment and got jobs but the labor force dropped by 57,000, for a new job gain of 204,000 jobs. At the same time 229,000 people left the labor force. The reduction in unemployment to 3.5% was due about in half to more jobs and about half to the shrinking labor force.
As usual, services led the way with 244,000 new jobs compared to only 44,000 for goods-producing jobs. The biggest gainer was leisure and hospitality, which added 83,000 jobs in September.
Among blue-collar workers, hourly wages increased a healthy 4.4%. Given the likely low inflation rate in September, that will probably turn out to be in the range of 3.5-4.5% in real terms. Weekly earnings went up a bit more than that due to slightly increased average hours worked per week.
Blue-collar workers have snapped a two-year decline in hourly wages with small pickups in August and September, mainly due to very low inflation rates. But they've overshot the decline needed to get back on their prepandemic trendline and are now about 1% below where they should be. This continues to be good news for inflation hawks who are scared that higher wages are propping up inflation rates.
Altogether this is a pretty good jobs report, though not a barn burner. If there's any justice, it should make the Fed fairly happy.
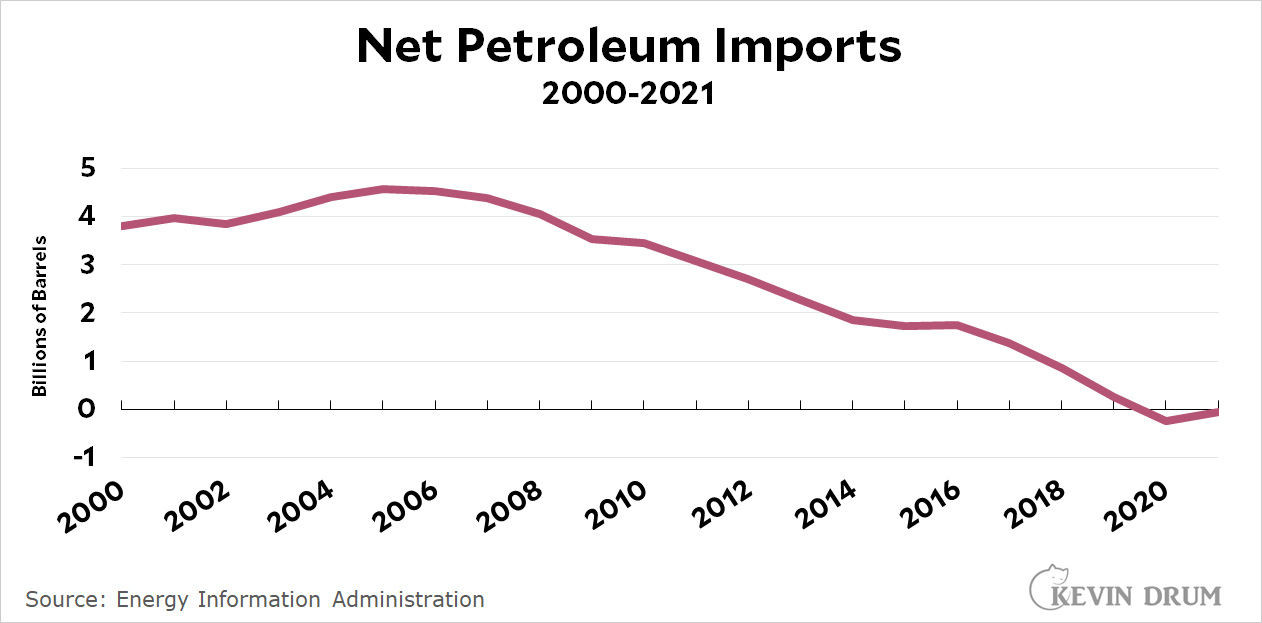
President Biden says he hasn't yet made up his mind what to do about OPEC's decision to cut oil production. And by "OPEC" he means "Saudi Arabia." As he's pondering, here's something that should be front of everyone's mind:
The United States is an energy independent nation. For convenience, we still import some oil, and for political reasons we still import a little bit of it from Saudi Arabia. But not because we need to. We could easily get along without any OPEC oil at all, which certainly broadens our retaliatory options.
But there are a couple of other things to consider. First, Europe and Japan do still import a lot of OPEC oil. With natural gas supplies from Russia cut off, the last thing they need is to be bit players in a US decision to risk OPEC oil supplies as well.
Second, cutting oil production affects the world price. Even if we don't actually import any foreign oil, we still pay that world price, the same as everyone else. Generally speaking, higher prices are great news for Russia, OPEC, and oil companies. They're bad news for gasoline consumers and the politicians who get blamed for higher prices at the pump. It's also bad for the economy at a time when the Fed is already determined to throw us off a cliff.¹
So a cut in production (a) affects our allies, (b) helps Russia, and (c) slows a global economy that's already slumping. It is frankly unclear why OPEC would do this. It's also unclear (to me) why we're mostly hearing from the US about this rather than all the European countries who have a good deal more to be mad about.
In any case, the silver lining here is that if the economy is already slumping, that will probably cut demand for oil. This means that a small cut in OPEC production might have no real effect at all. We'll see.
¹Not that we can blame that on Saudi Arabia, mind you.

 Over the past six months, the establishment survey says that employment has grown by 2.1 million, or 350,000 per month. This is the headline number reported every month.