
This is a surprisingly tricky question, but with a twist at the end. When you talk about earnings you have to account for at least three different things:
- Mean or median? Mean (aka "average" or "per capita") income is usually not a great measure because the ultra-wealthy skew it. If you have ten people making $50,000 and one person making $1 million, the mean income is a very misleading $136,000. Median is better: it records the halfway point of income and isn't heavily skewed by high incomes.
- Personal, family, or household? Personal is a single individual. A family is a group related by birth and marriage. A household includes everyone who lives in a particular housing unit.
- What income? There are lots of kinds of income. Cash income vs. benefits (like employer health care). Wages vs. investment income. Taxes (negative income) vs. government transfer payments. And capital gains are usually an entirely separate category.
Needless to say, there's also the distinction between nominal income and real income. Real income is adjusted for inflation and it's almost always what you should use. All of the charts in this post show real income.
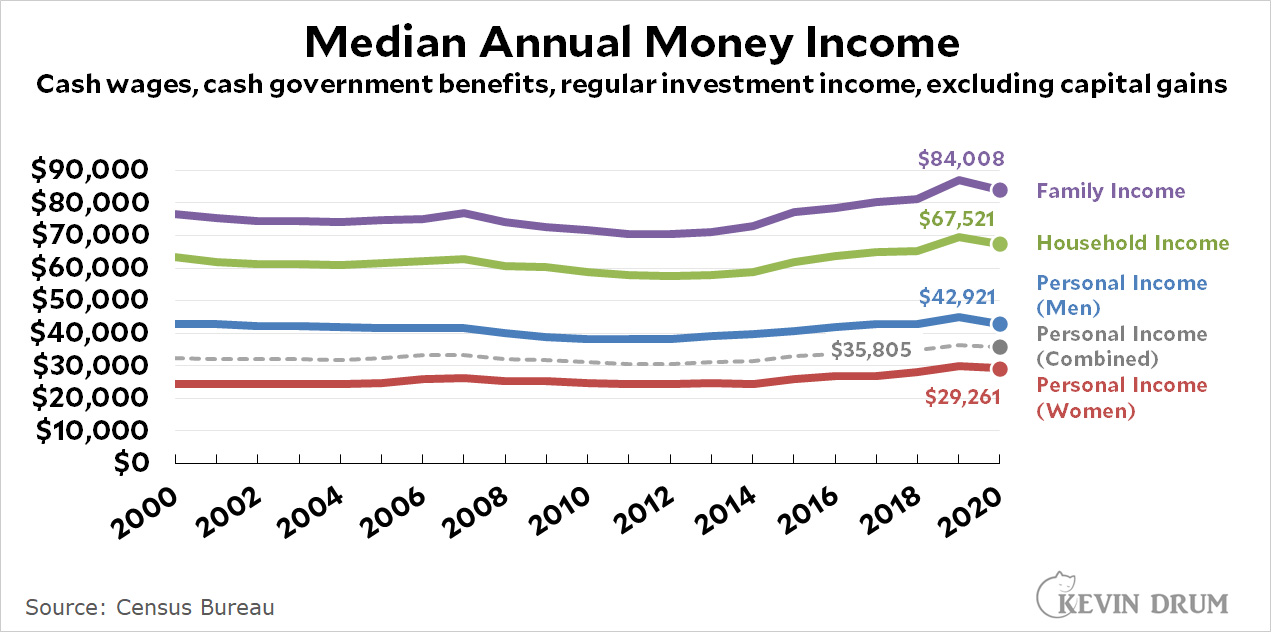
First off, the most commonly used set of earnings figures come from the Census Bureau:
 These figures are basically fine and are widely cited. They're really all you need for most purposes and they contain a wealth of breakdowns (gender, race, education, etc.). But if you want more, here's the personal income series from the Bureau of Economic Analysis:
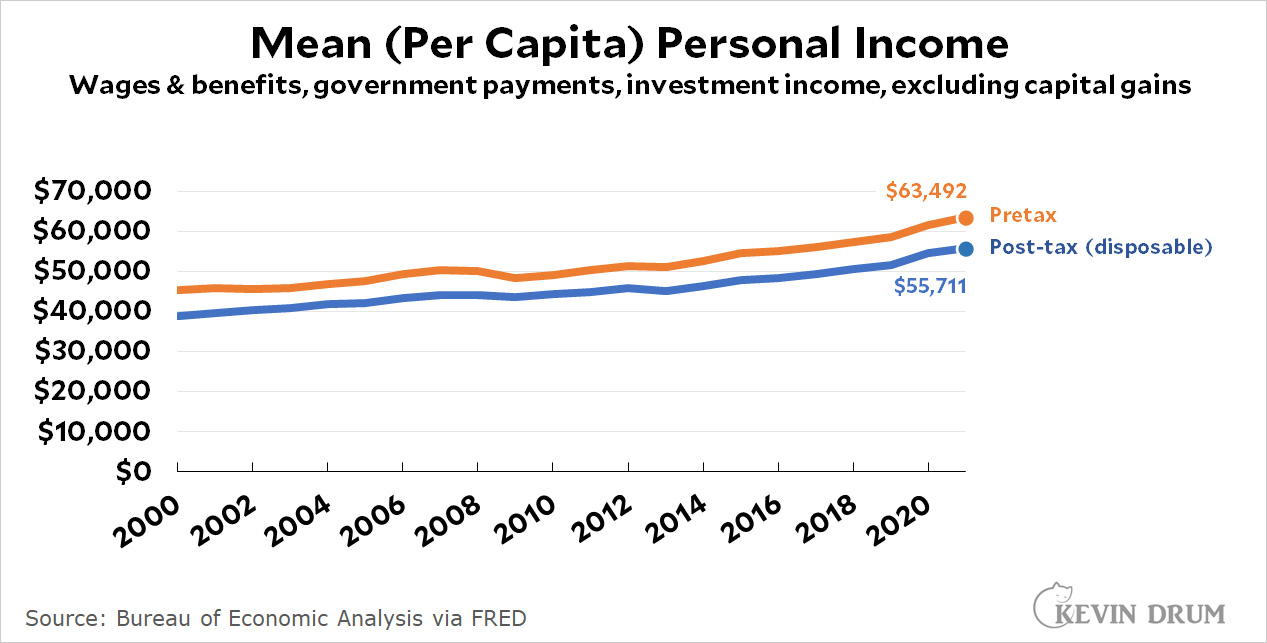 BEA income includes more items than the Census Bureau, and the BEA also provides a figure for disposable (after tax) income. But its big difference with the Census Bureau is that BEA uses mean instead of median income, which makes it much less valuable. The huge difference between the two is almost entirely due to this.
Next up we have an attempt by the Congressional Budget Office to account for everything, including means-tested government benefits and capital gains:
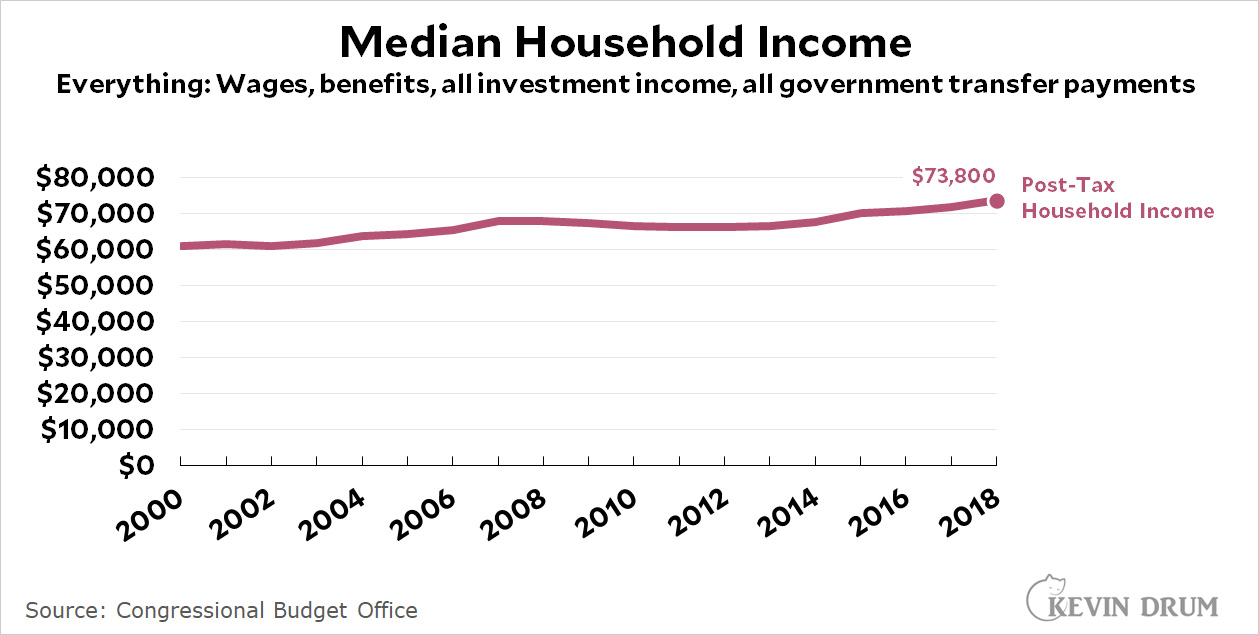 This is a good estimate of honest-to-God total income and taxes, and it's available as a median, so it's not skewed by the rich. Its big drawback is that it's not a regularly updated series. The last report to publish this information is from 2018 and there's no telling when they'll do it again.
Finally, here's a dark horse entry from the Bureau of Labor Statistics:
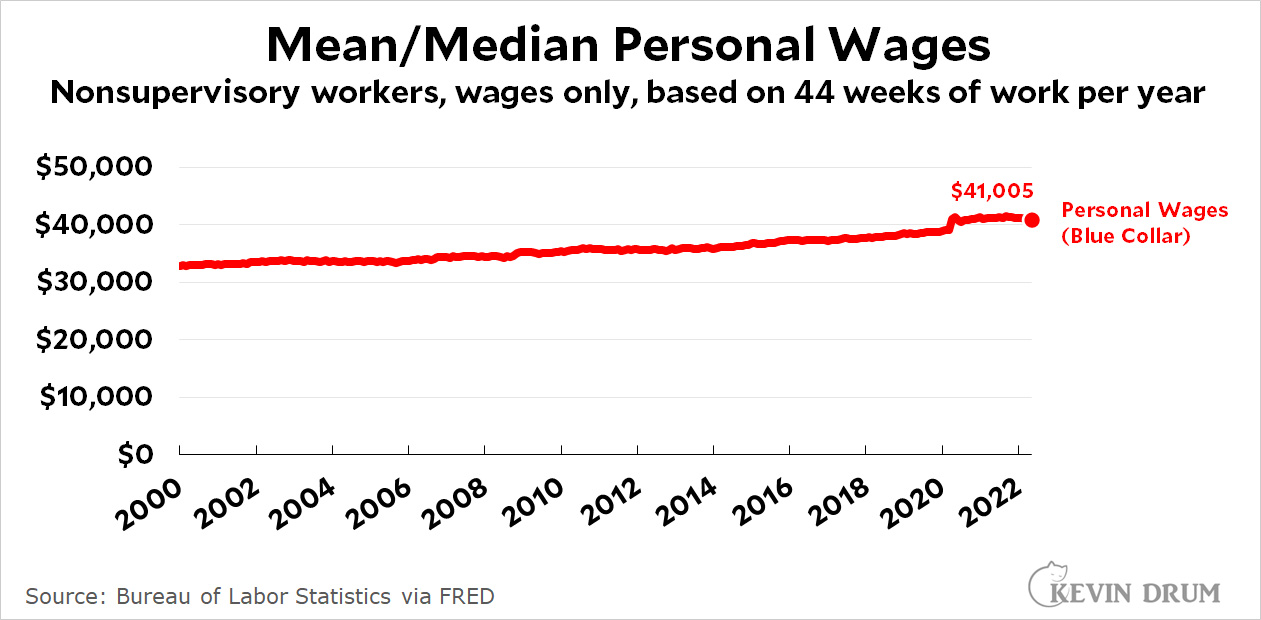 This chart shows wages solely for production and nonsupervisory workers, and it's extracted by multiplying average weekly wages with average weeks worked per year. No managers or CEOs or Elon Musks are in here. Just blue-collar, salt-of-the-earth American workers.
The downside of this series is that it includes only regular cash wages and nothing else. The upside is that it's updated monthly for you impatient types. And while it's technically a mean, the fact that it lops off the top 20% means that it's effectively a median. The meh-side—could be good, could be bad, depending on what you're interested in—is that it measures income solely for the 80% of the country that's nonsupervisory.
And now for the twist: there's really not much difference between all these measures. If you compare the BEA's mean income to the Census Bureau's mean income, they're pretty close. If you compare Census personal income to nonsupervisory personal income, they're pretty close. If you compare Census household income to CBO household income, the difference is noticeable but not huge.
In other words, all of these estimates use a slightly different combination of income and taxes but they mostly wash out at the end. Roughly speaking, I usually stick with simple Census figures. If you want post-tax income, use the BEA figures to figure out tax payments and then subtract them from the Census figures.
NOTE: Some of these figures are available in both nominal and real versions. Some aren't, and you'll have to do the inflation adjustment yourself.
Off topic: Boris Johnson is on the brink. His own party members are openly contemptuous. Republicans could learn a lot from their British counterparts.
...and he's gone...sort of....resigned but stayed on as caretaker...
A man whose career has been a firm confirmation of the prescient observation :"Entrusting Boris Johnson with any position of responsibility is like entrusting a gorilla with a Ming vase."
The census gives family income by percentile:
https://skeptometrics.org/FamilyIncomepctiles.png
This is very helpful if you want to see the growth of inequality over time (as Kevin rarely seems to be). Of course the biggest inequality is in the income growth of the 1%, or even more the 0.1%, which is literally off the chart.
Thanks.
My fav is the median family income vs GDP/family
Middle fifth percentile FTW.
I like the Census Bureau median annual money income chart (first one). Dumb question that I should be able to find:
It shows combined male/female income as $35,000/yr.
Is this per person of working age (18-65)? Or per worker? Everyone actually working. It must be the second right? And labor force participation explains most of the male/female gap?
Shoot, I meant the first, it’s per person of working age, so participation explains…
Yes. People's are poor relatively speaking. Now you know why 50 percent fo America has one- yes, one- percent of our wealth,.
And it is done on purpose.
We will all be making more money once we burn through the pandemic stimulus money and return to work !!!
So says Mitch McConnell
I've always disliked counting benefits as income. You can't use it freely and there's no guarantee you'd spend the money the same way if you could. For example younger/single/riskier people may get a cheaper healthcare plan if they got the cash equivalent to benefits.
Beg to disagree. Income is income, however it's distributed. How it is spent is a whole other issue.
If you want to get granular, you can argue that the effect of non-monetary compensation varies - as in how much an employee puts into their 401K to get matching funds affects their total compensation. But are long as they are contributing, they are getting non-taxed income from their employer.
I still remember all the times back in the 1990s and oughts when my raise would be entirely eaten up and then some by my employer's increasing health insurance premium share going up and up each open season. It sure didn't feel like my paycheck got any bigger at all.
Well I agree they should count for something but you can't pay a rent increase with health benefits so it's clearly not the same.
But how do you feel? Who do you blame?
Policies have lag times before people feel it and the effects work their way through the economy. And routinely they'll be surveys saying "I'm ok, the rest of the country must be really bad so I'll throw the bums out". Or the inverse.
The Republicans will try to pin the pandemic problems on Democrats and stall any bills that might help now.
Waste of a post.
Another thing to consider is that the supervisory / non-supervisory boundary is almost certainly the exempt / non-exempt bounday which is partly defined by income level. If you want that fifty cent an hour raise at the fast food joint, you often have to agree to becoming a "supervisor" or "manager" of some sort and hope that the increased wage makes up for the fact that you are no longer eligible for overtime pay. Often, a promotion like that means a decrease in one's hourly wage.
Statistically, it also removes one from the non-supervisory pool.